Montgomery County is home to some of the most diverse communities in the country. Diversity is essential to the county’s economic success as well as to our ability to produce high-quality housing, education, jobs, transportation, and recreational opportunities. Montgomery Planning’s role is to plan for the county’s land-use growth in the decades to come. In order to plan for the county’s residents, we must understand who they are. Our Research and Strategic Projects division produces in-depth analysis of the demographic characteristics of Montgomery County’s population, which currently is more than one million people. This research supports master plan recommendations, land use policy decisions, and serves as a valuable resource for local government officials and the public. On this page, you’ll find a variety of data on population characteristics through research publications and interactive tools.
Demographics snapshot
Interactive tools
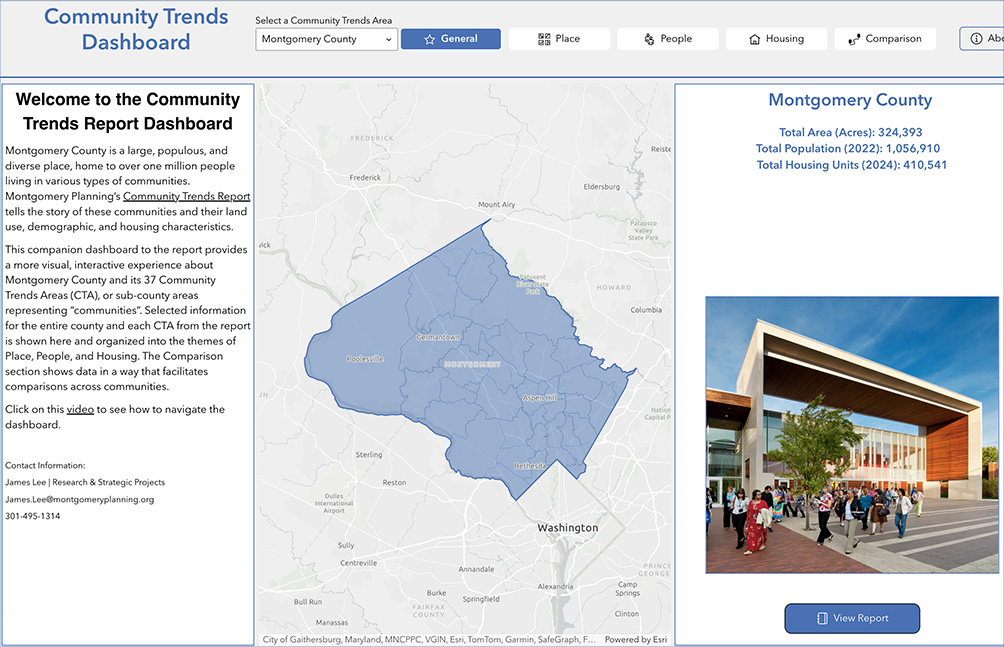
Community Trends Dashboard
This interactive dashboard is a companion piece to the Community Trends Report. Users can view and compare land use, demographic, and housing data across communities and download information about each community as PDF profiles.
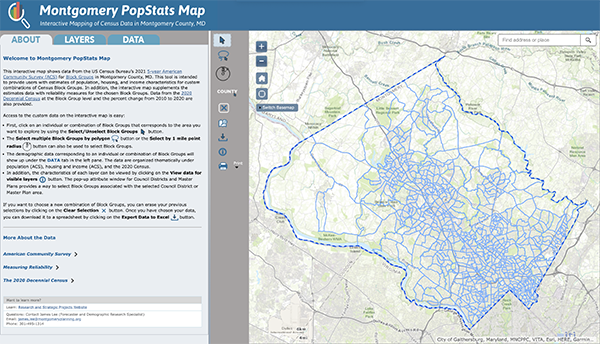
Montgomery PopStats Map
This tool provides users with estimates of population, housing, and income characteristics for custom combinations of Census Block Groups in Montgomery County. Data are from the US Census Bureau’s 2021 American Community Survey (ACS) 5-year estimates.

Languages Spoken in Montgomery County
This interactive map shows areas in Montgomery County that have sizeable concentrations of residents with limited English proficiency and the top foreign language spoken by residents in these areas. Data are from the US Census Bureau’s American Community Survey (ACS), 2022 5-year estimates. In addition, you can also download a PDF version of Languages Spoken in Montgomery County map.
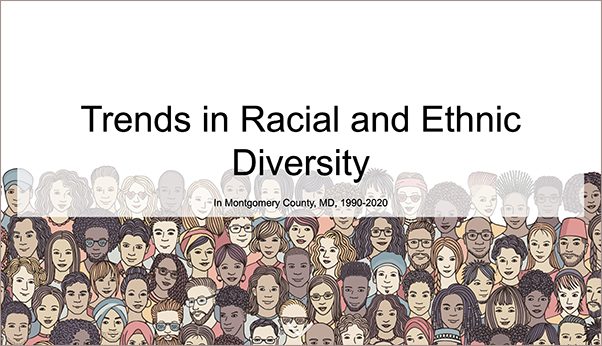
Montgomery County Trends: Racial and Ethnic Diversity Story Map
This story map describes racial and ethnic changes in Montgomery County over 1990-2020. Historical Decennial Census data are used to illustrate the trends and spatial concentration of four major groups (non-Hispanic Asian, Black, and White, and Hispanic) at the Census Tract level.

Equity Focus Areas Story Map
Equity Focus Areas are communities that may not have equitable access to resources or opportunities for employment and services that support a good quality of life. This award-winning visual representation of the Equity Focus Areas Analysis provides a critical tool to assess potential racial and social inequities and helps direct planning efforts that will foster more equitable outcomes for communities.
Reports
Countywide demographic analysis
Community Trends Report: A Look at Montgomery County Communities Since 2010 – This report is a first-ever comprehensive study of changes over time since 2010 in small areas of Montgomery County and analyzes land use, demographics, and housing characteristics in each of the county’s communities.
Montgomery County Trends: A Look at People, Housing, Jobs Since 1990 – This study analyzed countywide population, housing, and employment trends between 1990 and 2016, with the goals of describing both major changes since the 1993 General Plan refinement and current conditions to inform needs assessments and policy discussions for Thrive Montgomery 2050, the most recent General Plan update completed in 2022.
QuickStats/Trends At-A-Glance
Demographic analysis by population group
Older Adult Population in Montgomery County
Asian and Pacific Islander Population in Montgomery County
Black Population in Montgomery County
People with Disabilities in Montgomery County
Hispanic Population in Montgomery County / La población hispana en el condado de Montgomery
Demographic analysis by geography
Demographic Profile of Montgomery County’s Council Districts (2022) – Presented to the County Council, January 24, 2023: Download slides | Watch video
Demographic Profile of Montgomery County’s Council Districts (2016)
Friendship Heights Village Demographics – This presentation highlights key demographic characteristics of the Village of Friendship Heights and was delivered at the Village Council’s October 16, 2023 meeting. A recording of this meeting can be accessed on the Village of Friendship Heights website.
Blog posts
Tracking the Changing Child Population in Montgomery County
Published on May 19, 2026
Findings from the 2024 American Community Survey: Montgomery County, Maryland, and the United States
Published on September 19, 2025
Montgomery County’s Population Rebound, Part 2: A comparison with our neighbors
Published on December 18, 2024
Montgomery County’s Population Rebound, Part 1: Recovering from the COVID-19 Years
Published on June 21, 2024
Profile of women in Montgomery County by the numbers
Published on March 21, 2024