Overview
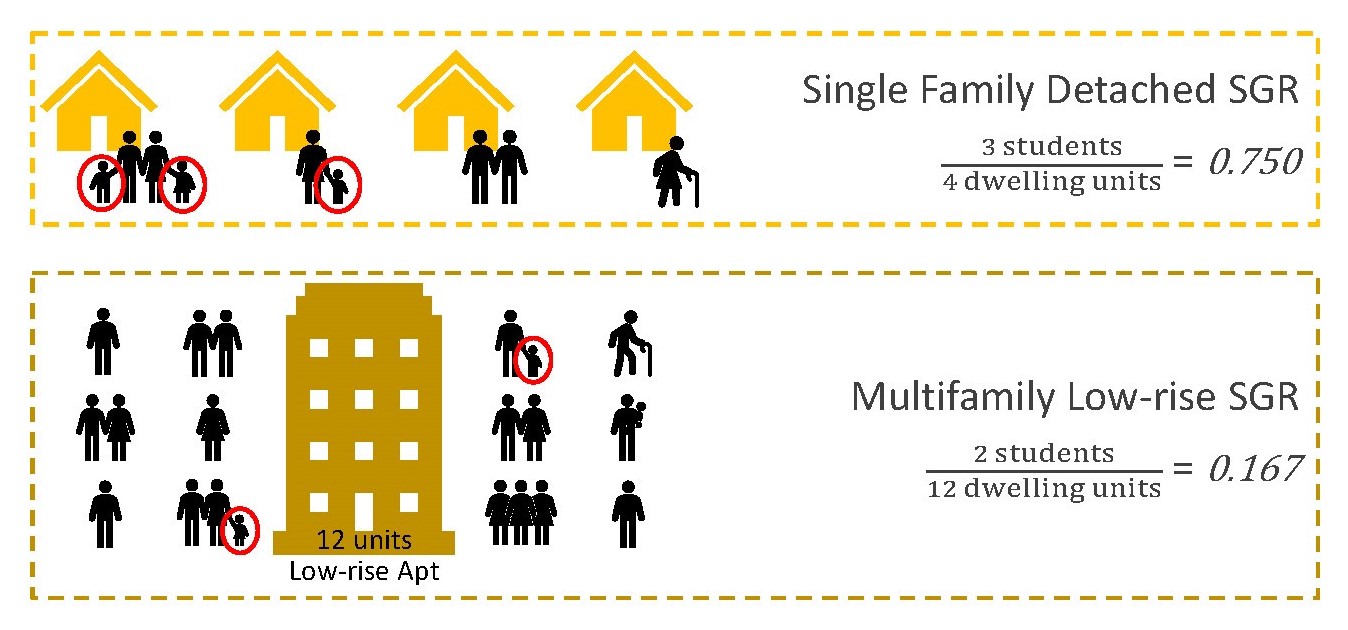
Student generation rates are used to estimate the number of public school students that a residential development might generate in an average year throughout its life. It depicts the average number of students living in a residential unit and is calculated by dividing the number of students living in a particular type of residential unit and geography by the number of such units within the geography.
| SGR = | number of students |
| number of residential dwelling units |
For example, the student generation rates of the residential units below are:
Montgomery Planning’s Official Student Generation Rates
Montgomery Planning’s official student generation rates are calculated for each School Impact Area, including Turnover Impact Area and Infill Impact Area, as well as by residential unit type. These unit types include single-family detached, single-family attached, multifamily low-rise, and multifamily high-rise.
Since 2014, student generation rates have been determined using datasets that encompass the entire county, specifically Montgomery County Public Schools (MCPS)’s official student enrollment list and a countywide housing dataset derived from the Maryland State Department of Assessments and Taxation (SDAT) property data. This approach replaces the use of sample statistics with comprehensive data from the county. The official rates are used to estimate the impact of residential development applications or master plans, and to calculate school impact tax rates. These rates are updated every two years, specifically on July 1 of every odd-numbered calendar year.
Definitions for Multifamily Structures
For student generation rate calculation purposes, a multifamily low-rise is defined as a structure with fewer than 5 stories. For multifamily units, Montgomery Planning’s official rates only include those in buildings constructed in 1990 or later.
For student generation rate calculation purposes, a multifamily high-rise is defined as a structure with 5 or more stories. As with multifamily low-rise units, only those in structures built in 1990 or later are considered for the official student generation rates.
MCPS Enrollment Projection Rates
Montgomery Planning also calculates a separate set of student generation rates for MCPS to assist with their enrollment projections. These rates are determined by high school service area, and unlike the official rates, the multifamily rates include units in all structures, regardless of the year the structure was built.
How does housing turnover impact student generation rates?
During the 2020 Growth and Infrastructure Policy (GIP) update, Montgomery Planning examined the student generation rates of single-family homes by considering the year they were last sold, regardless of their construction date. The graph below shows that homes sold within the past 15 years have significantly higher student generation rates compared to the average for all single-family detached units. This indicates that most enrollment growth in the county results from residents moving in and out of existing housing.
Additionally, the 2020 GIP update revealed that 76.7% of the county’s public school enrollment increase was due to existing units. This also explains the fluctuations in enrollment growth that many individual school service areas experience as residents in neighboring neighborhoods change.