About the data
The Montgomery Planning GIS team maintains impervious data and component datasets. These include building footprints, bridges, athletic courts/non-residential pads/patios, bridges, driveways, parking lots, sidewalks, roads, and transformer substations. Collectively these are known as planimetric data. This data is collected every three years to coincide with the Maryland State orthoimagery program which provides us with the required stereopair imagery free of charge.
The latest data was collected in March 2023.
Accessing the Impervious Data
Viewing in MCAtlas
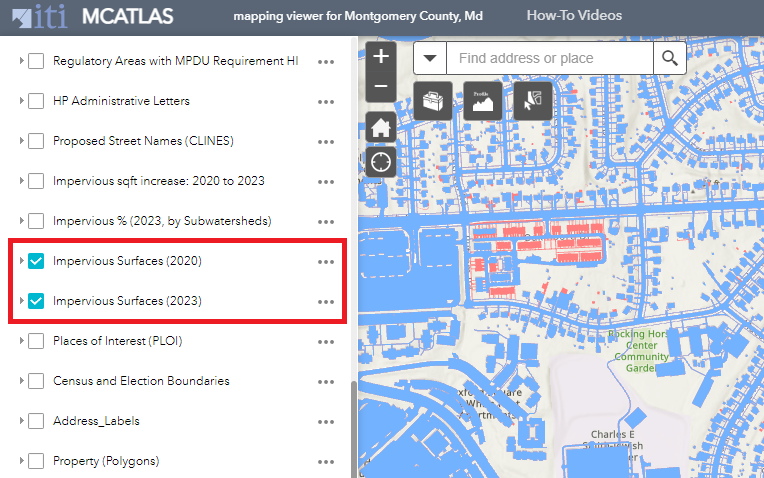
The data can be viewed in MCAtlas. Layers are available for data captured in both 2020 and 2023. When both layers are turned on, areas in red are those that have become newly impervious between 2020 and 2023.

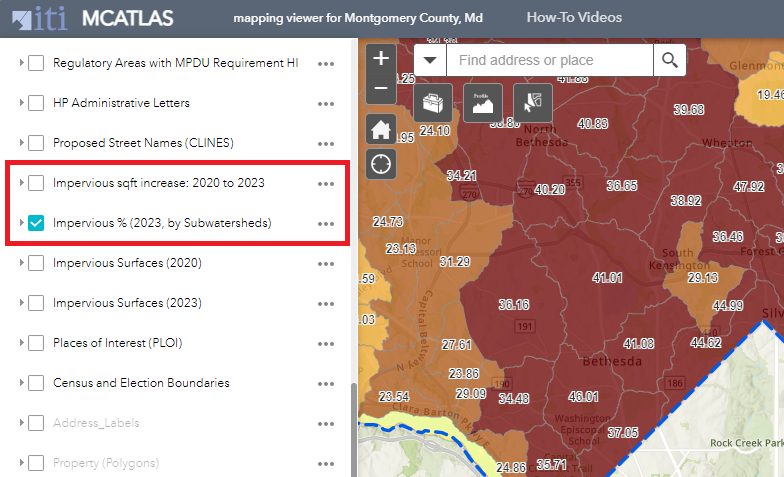
There are two pre-calculated layers that display impervious statistics by watershed. One shows the total percent impervious and the other shows the impervious change in square feet between 2020 and 2023.

Calculating in MCAtlas
Two additional tools located in the upper right of MCAtlas will calculate the percent imperviousness of any inputted polygon feature:

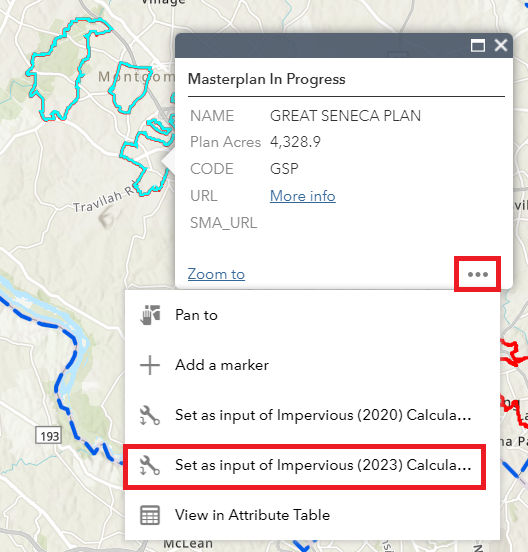
First select a feature. Then under the feature settings, choose to “Set as input of Impervious”:

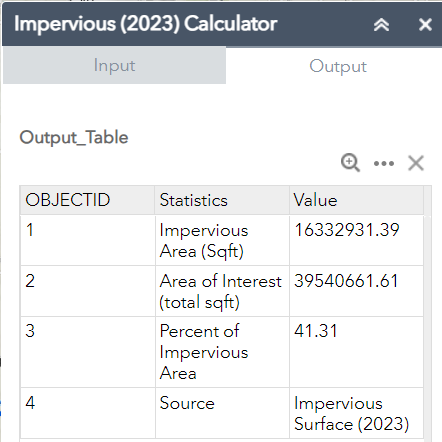
An output will be returned with the impervious area, the total area of the polygon, and the percent impervious area:

Data downloads and services
Impervious data can be downloaded in file geodatabase format from the Data Download page.
Impervious data map services:
Individual datasets used in creating the 2023 impervious data layers: