Taking a data driven, proactive approach to identifying transportation safety challenges and solutions in Montgomery County.
Background
Between 2015 and 2019, there were over 59,000 crashes in Montgomery County, resulting in over 1,200 severe injuries and nearly 150 fatalities. As part of Montgomery County’s Vision Zero goal to eliminate traffic deaths and severe injuries by 2030, Montgomery Planning is using a new strategy to improve road safety for drivers, bicyclists and pedestrians called the Predictive Safety Analysis. This proactive data-driven approach works to prevent severe and fatal crashes before they happen.
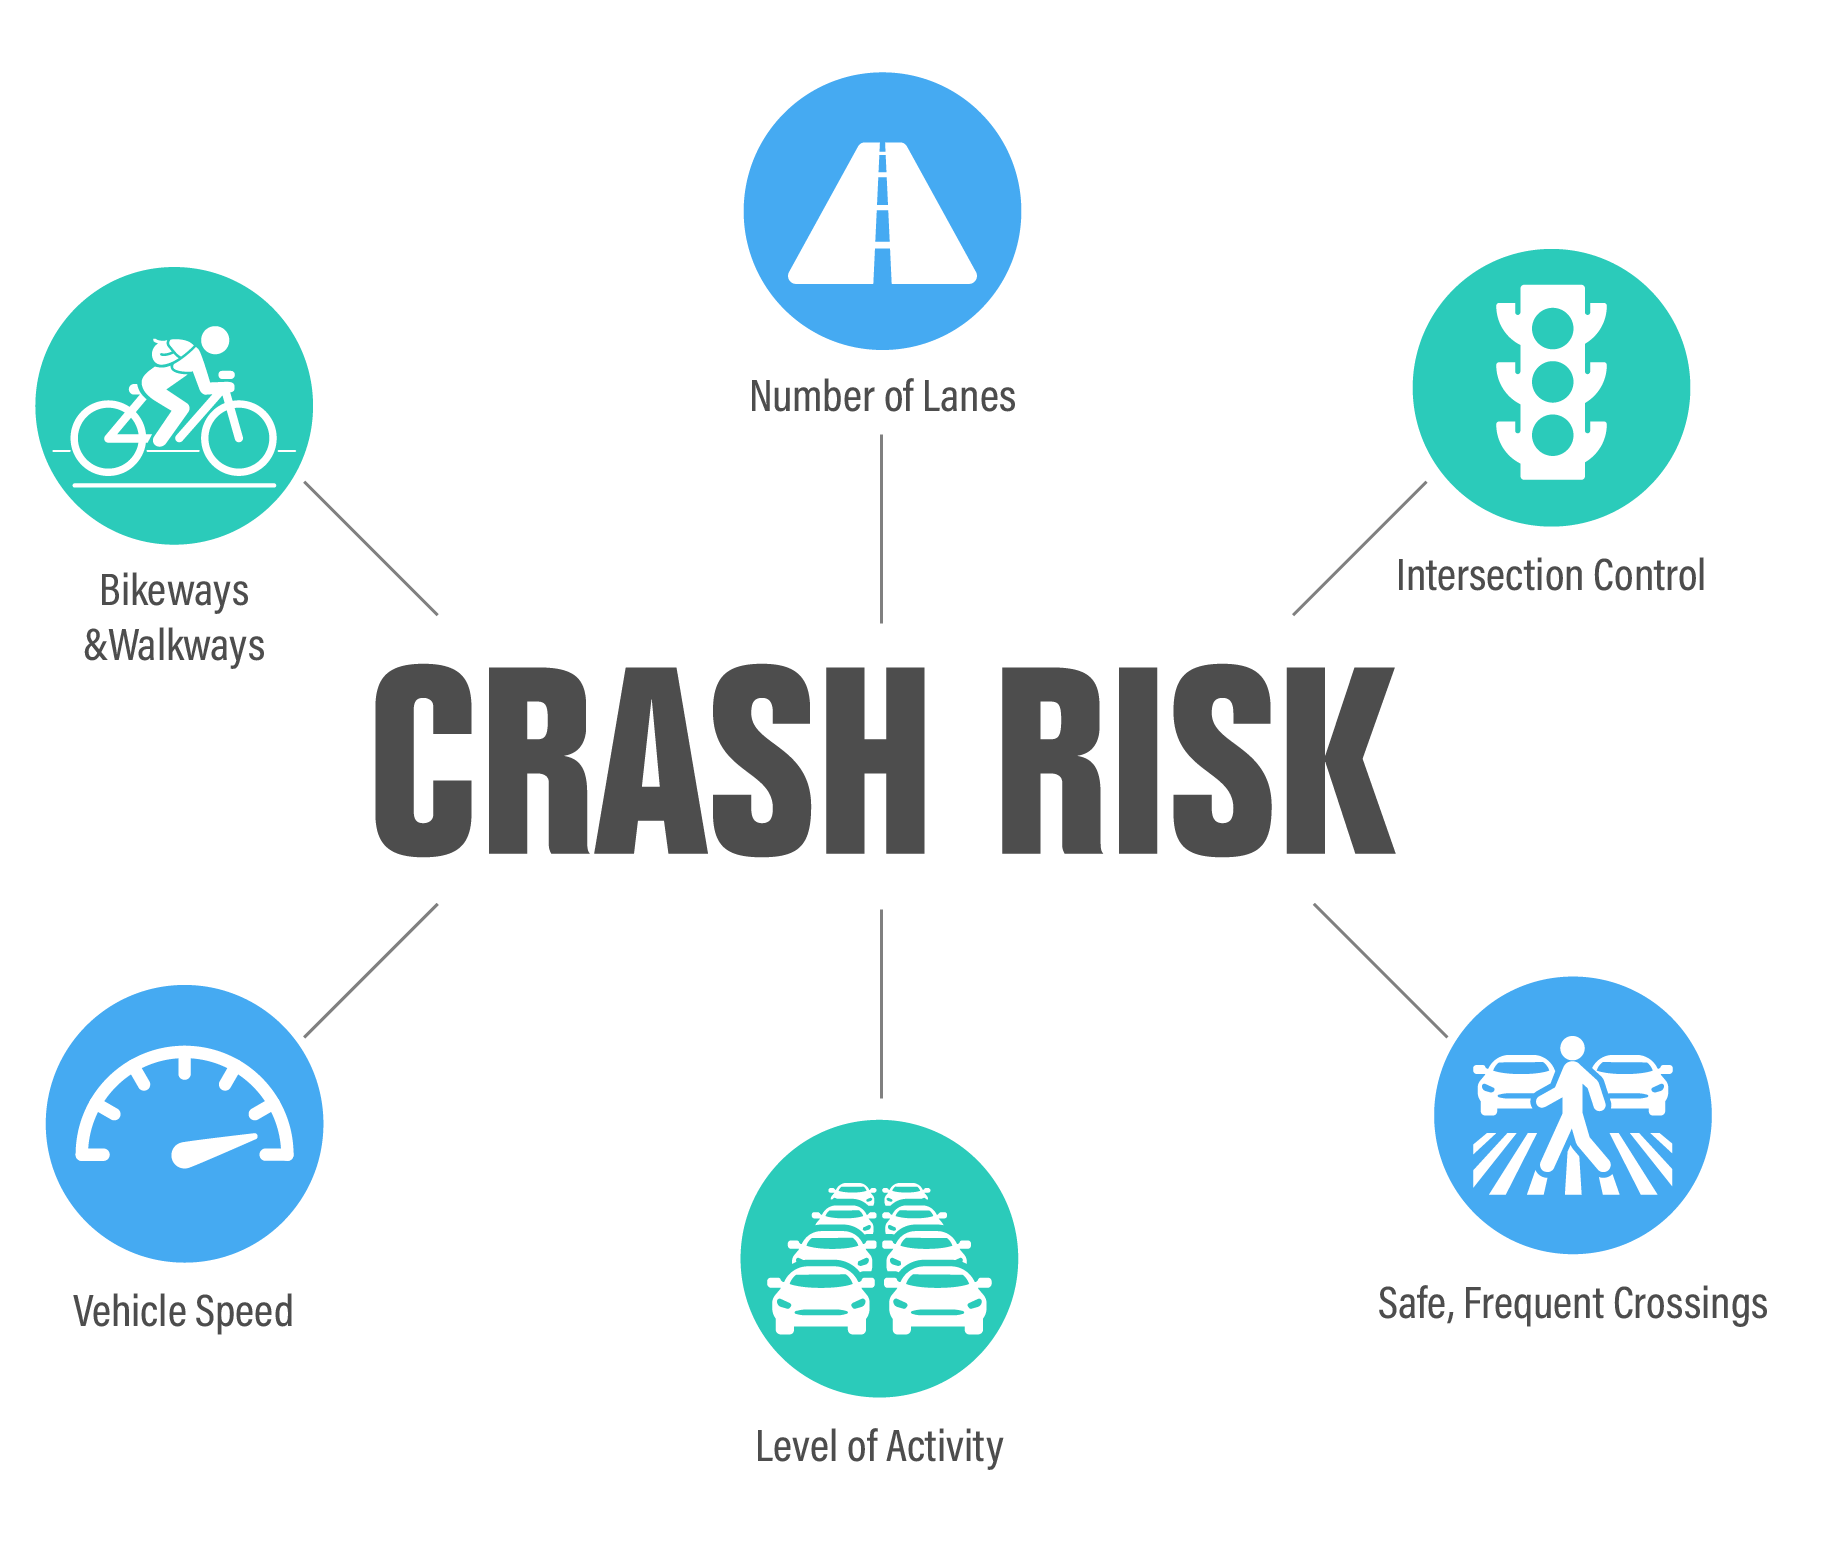
The Predictive Safety Analysis estimates the expected number of crashes at a given roadway segment or intersection through Safety Performance Functions (SPFs). SPFs are equations (or models) that predict the number of crashes on roadway segments and at intersections based on exposure (the amount of walking, bicycling and driving), roadway characteristics, and other variables. This analysis then allows the county to prioritize where and how to most effectively invest in safety improvements through capital projects, development approvals, and master planning.
Review the Predictive Safety Analysis Executive Summary: English | Espanol
Key Findings
Through this analysis, a few key findings emerged:
- Prioritization needs to look beyond crash history. In the past, Montgomery County has sometimes taken a reactionary approach to transportation safety, implementing site-specific improvements in the aftermath of a fatal crash. The results of this analysis show that prioritizing safety treatments based solely on locations with a history of severe injury and fatal crashes could result in unaddressed crash risk.
- As a suburban county, much of Montgomery County’s crash risk is in the suburbs. The county’s suburban areas and the high-speed, high-volume suburban Boulevards that run through them have the highest concentration of crash risk in the county for most crash types. To reach Vision Zero, safety improvements must address these locations.
- Yet Downtowns and Town Centers have the highest average crash risk. On a per-intersection or per-roadway segment basis, crash risk is highest in the county’s urban areas, particularly for pedestrian and bicycle crash types. Systemic improvements on Downtown Boulevards (for example, Georgia Avenue in Downtown Silver Spring) and Town Center Boulevards (for example, Veirs Mill Road in the vicinity of the Randolph Road intersection) – and more broadly in Downtown and Town Center areas – would yield the greatest benefits per location improved.
- Safety improvements in Equity Emphasis Areas (EEAs) should be prioritized. Across all metrics, crash risk is disproportionately concentrated in EEAs. More than half of the top 200 locations for pedestrian crash types are located within EEAs, and the average crash risk in EEAs far exceeds that for non-EEAs for five of the six crash types.
How the Results Can Be Used
The Predictive Safety Analysis is the first step towards implementing a proactive approach to safety. It is now incumbent upon planners, engineers, and decisionmakers to apply the findings of this analysis. There are several uses of the results of the Predictive Safety Analysis:
- Apply Data-Driven Planning: The Predictive Safety Analysis provides the data, analysis, and tools to shift the county’s approach and implement improvements where they are needed and more equitably. These data can combat the “squeaky wheel” by distributing resources equitably and to where they are most needed.
- Identify Locations with High Crash Risk: The results can be used to identify location types that are likely to experience a high number of crashes. These data can be used to inform Capital Improvement Program (CIP) project prioritization, prioritization of off-site mitigation for new developments, and a focus for transportation improvements within master plan areas.
- Prioritize Safety Improvements: The tools allow implementing agencies to prioritize where to implement systemic safety treatments as well as to assess which safety treatments may be the most effective at reducing crashes.
- Determine Locations with Similar Conditions: The databases developed include hundreds of variables related to the transportation, land use, and demographic context in which the crash occurred. In the wake of future severe or fatal crashes, these data can help identify other “like” locations to the crash and inform a more systemic response to the incident.
Staff Contact
Richard Brockmyer
301-495-4526
Email