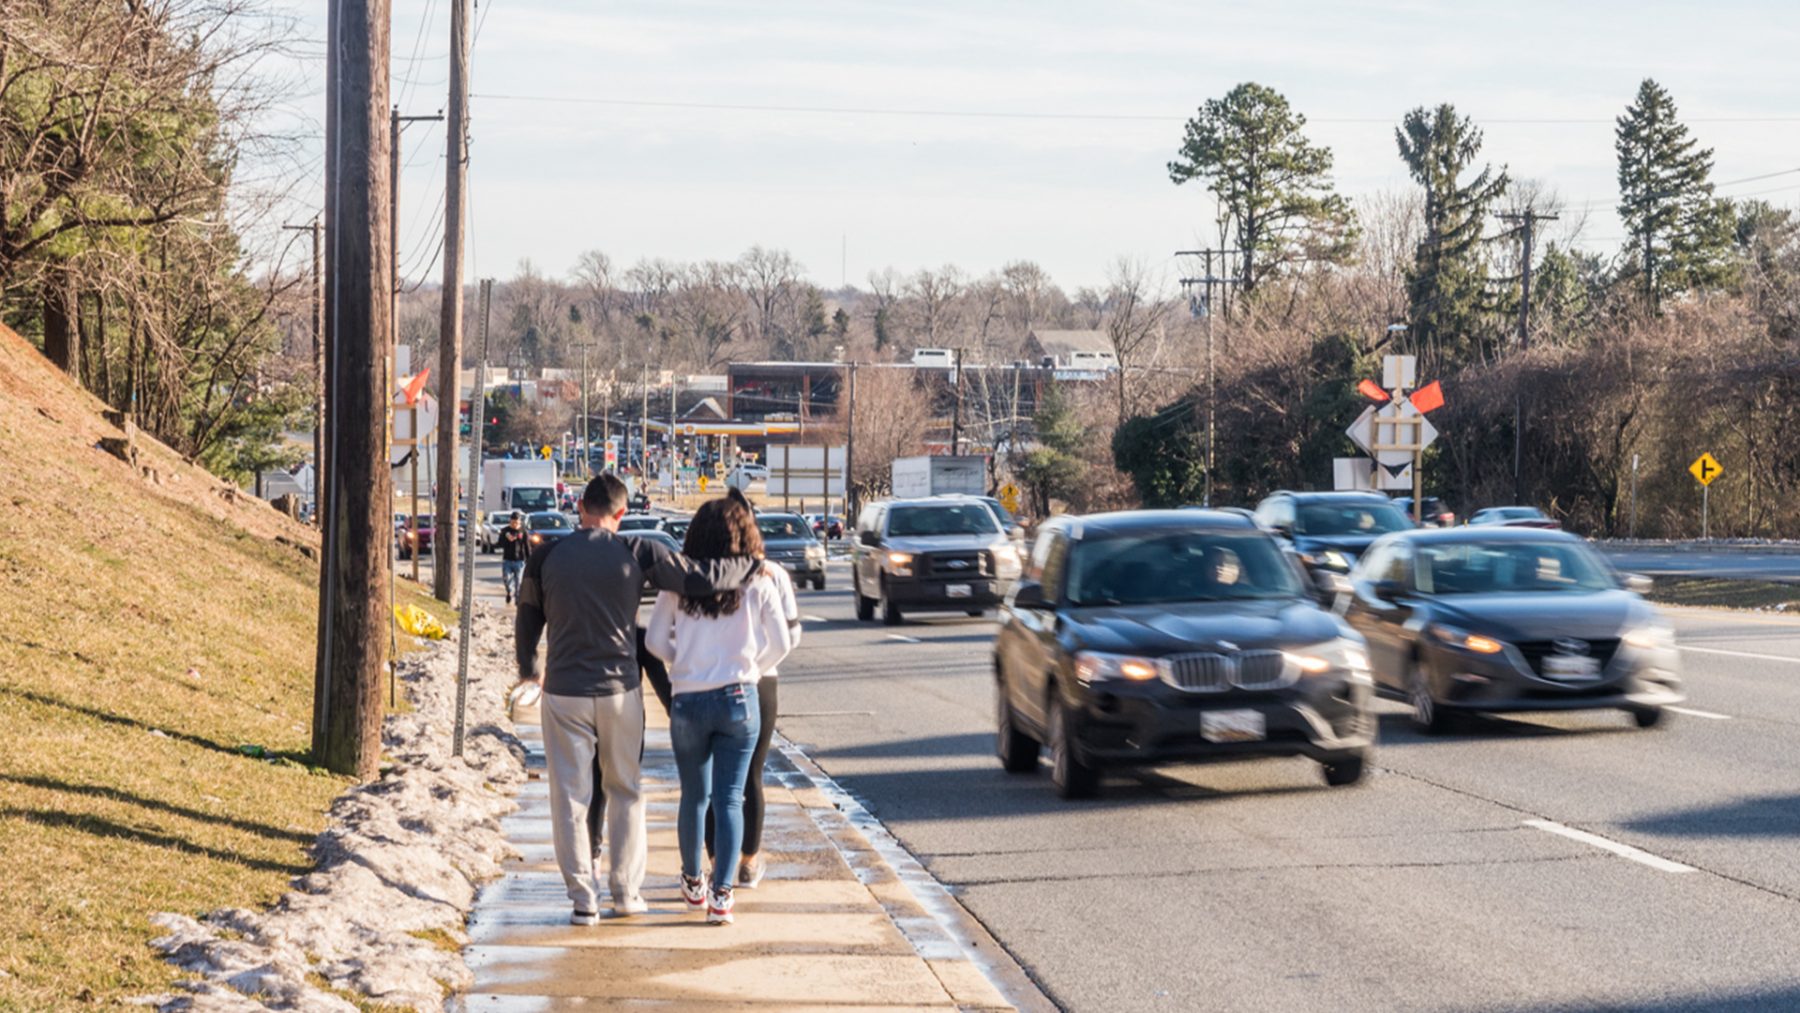
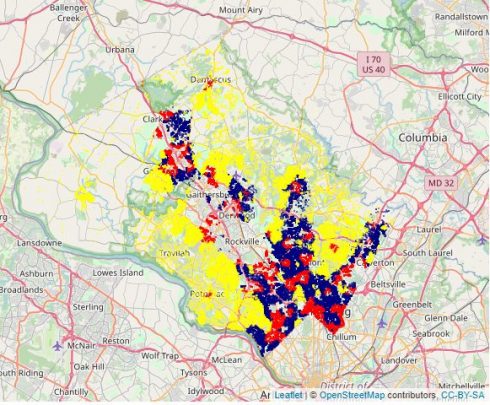
The Pedestrian Master Plan team recently completed the first ever pedestrian survey of Montgomery County households in fall 2020 to better understand how often and for what reasons residents are walking and rolling. Survey results were compiled at the countywide level and for three smaller areas:
- Urban (Downtowns and Town Centers) – Red
- Transit Corridors (Within one mile of transit corridors) – Blue
- Exurban/Rural (The remainder of the county) – Yellow
A postcard with a unique link to the online survey was sent to 60,000 randomly selected households in the county. In addition to English, the survey was available in Spanish and Simplified Chinese. Households in Rockville and Gaithersburg were not included because they have independent planning authority.
Initially, the team hoped to receive a 2% response rate but was pleasantly surprised by the final response rate of 4.1%. The strong response resulted in a countywide survey margin of error of only 2%. This means that for any given answer, there is a 95% likelihood that the survey response is within 2% of the “true” response for the county. Similarly, each smaller area has a margin of error:
- Urban: 4%
- Transit Corridors: 3%
- Exurban/Rural: 3%
Survey responses were weighted to better represent the actual demographics of Montgomery County using the American Community Survey 2018 5-Year Estimates for income, race, and Hispanic, Spanish, or Latino origin distributions for each geography to ensure the responses are appropriately representative of each area and the county as a whole.
For the first time, this survey effort provides detailed insights into the pedestrian travel behavior of Montgomery County residents. The results of the survey will be used to develop the Pedestrian Master Plan’s forthcoming Existing Conditions Report and potential plan recommendations. Survey results will also be used to benchmark pedestrian conditions and compare them to future iterations of the survey.
View the NCAC-APA 2021 presentation by Jesse Cohn McGowan on the Pedestrian Master Plan Survey to better understand how often and for what reasons residents are walking and rolling in Montgomery County.
Satisfaction
Overall, 52% of respondents were satisfied with their pedestrian experience. This percentage is higher in Urban areas (60%) and lower in Exurban/Rural areas (46%). Notably, respondents with reported disabilities were nine percent less satisfied than respondents as a whole.
As this survey is redone in future years, planners will be able to measure improvements in satisfaction as an indication of the enhanced quality of the pedestrian environment, in addition to our efforts to improve accessibility for members of our community with mobility or other disabilities.
Trip Purpose
The most common reason people walk is for exercise and outdoor recreation. This is true across all geographies. 91% of respondents walked for this purpose in the preceding month. Beyond this specific purpose, respondents living in Urban areas were much more likely to walk for grocery/food shopping (73%), personal business (58%), dining at restaurants/bars (38%) and other purposes than residents in Transit Corridor or Exurban/Rural areas.
Trip Length
Trips for exercise and outdoor recreation are the pedestrian trips of longest duration countywide. These trips are usually longer than 20 minutes. In Urban areas, the majority of non-exercise / non-recreation trips are less than 20 minutes long, but this is not the case in Transit Corridors and Exurban/Rural areas where the majority of the same types of trips are 40 minutes or less. This makes sense if you consider that destinations are much closer in Urban areas than in the rest of the county, so all things being equal, the same types of trips can be accomplished in less time in Urban areas. It also makes sense then that with fewer destinations within close proximity requiring longer trip durations in Transit Corridors and Exurban/Rural areas, fewer people are willing to walk for non-exercise/outdoor recreation purposes, and that’s borne out in the data.
Personal Safety
Several survey questions focusing on understanding the complexities of comfort in public spaces. 73% of respondents feel safe while walking or rolling in public space with no significant differentiation by land use. About one-third of respondents are concerned about crime in their neighborhood though this is a bigger issue in Urban and Transit Corridor areas. At the countywide level, 34% of respondents have seen or personally experienced harassment or violence while walking with the issue being more apparent in Urban areas. 57% of respondents feel more comfortable when they see police in public spaces. We are in the process of understanding if there are other ways we can parse these data on racial or ethnic lines.
Most Important Improvements to Lead to More Walking
The survey used a “MaxDiff” analysis to learn what pedestrian improvements respondents felt would most increase walking and whether responses vary by area types. In the figure below, values of 60 or greater are significant. Respondents in Urban areas and along Transit Corridors value drivers more consistently stopping for them while crossing the street, new sidewalks along their pedestrian routes where there are not sidewalks now and feeling safer while walking. In Exurban/Rural areas, respondents valued new sidewalks even more strongly, as well as feeling safer while walking, but put a higher importance on walking on sidewalks that were further away from cars on busy streets than on drivers consistently stopping for them.
COVID-19 Impacts
As the survey was conducted in fall 2020, it included questions about changes in travel behavior due to COVID-19. In terms of walking trips, 66% of respondents shared that they are taking fewer pedestrian trips to restaurants or bars, 53% are taking fewer commute trips and 50% are taking fewer trips for entertainment or to visit friends and relatives. At the same time, 51% of respondents are walking more for exercise and recreation and 52% are walking to medical appointments about the same amount.
This is in line with what we would expect as public health requirements have restricted bar and restaurant access and led to more teleworking.
The nature of telework is of particular interest for planners looking to understand the potential lasting effects of COVID-19 on travel behavior. The survey asked respondents about their telework frequency before and during COVID-19 and their expectation for future telework. While 30 of respondents said they teleworked at least one day a week before the pandemic, 74 percent indicated they telework at least one day a week during the pandemic. 54 percent of respondents anticipate being able to telework at least one day a week after the pandemic ends.
All told, respondents indicated they would telework about 90% more after COVID-19 than before. If this increase is borne out, there will be implications on how we model the traffic demands of new development, parking requirements for commercial/retail businesses, and many other elements of master planning and regulatory work.