About the data
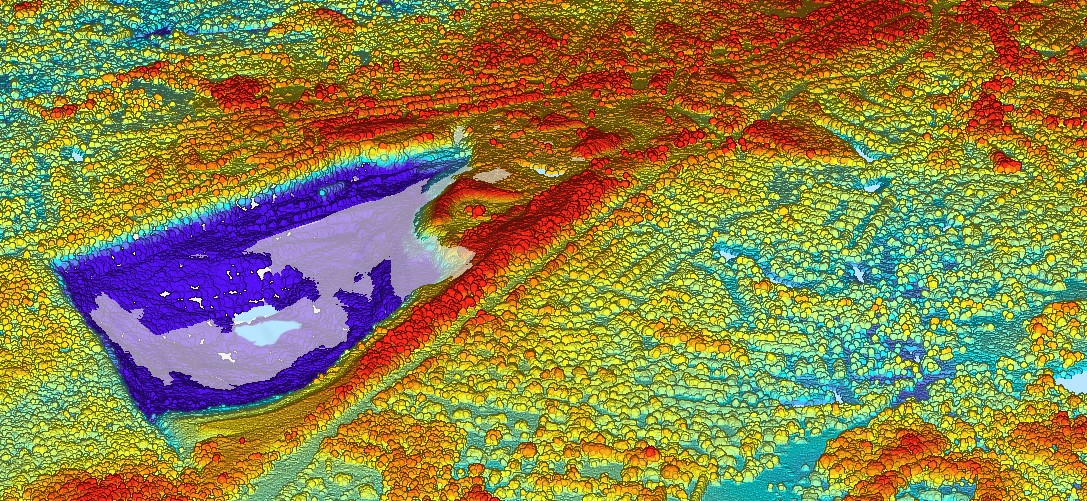
The Montgomery Planning GIS team acquires LiDAR (Light Detection and Ranging) elevation data on a 3-year cycle. After collecting LiDAR data in 2017 and 2020, the current data was captured in late 2023 and early 2024. LiDAR is a remote sensing technique that uses lasers to measure distances to create 3D models of the Earth’s surface. A laser instrument is mounted on an airplane which sends out pulses of light from the airplane as it traverses the area of interest. The distance between the light source on the airplane and the object (for example buildings, trees, and other vegetation) or surfaces (for example ground, roads/parking lots, and water) is calculated using the time it takes to for the light to return to the instrument. LiDAR data acquired for the last two cycles (2020 and 2023) is of QL (Quality Level 1) technology (8 points per square meter).
If you chose to download the data sets below, please indicate ”Montgomery County Planning” as the source for your analysis and maps.
Downloading LiDAR Point Cloud Data
If are interested in using LiDAR data for your own analysis, compressed point cloud files (.laz) can be downloaded by WSSC Grid from the mapping application below. Click on the grid tile of interest and press “download” in the resulting pop-up. Once downloaded, you will need to use the “Convert LAS” Geoprocessing Tool within ArcGIS Pro to convert the compressed file(s) from .laz to .las to use the LiDAR point cloud data. If you are interested in large areas, mail an external hard drive with instructions on which areas you are interested in, to:
Jay Mukherjee
2425 Reedie Drive, 13th Floor
Wheaton, MD 20902
jay.mukherjee@montgomeryplanning.org
Downloading Elevation Data (Rasters and Contours)
Once the Montgomery Planning GIS team receives LiDAR data, various ancillary elevation products are created from the LiDAR data and available for download.
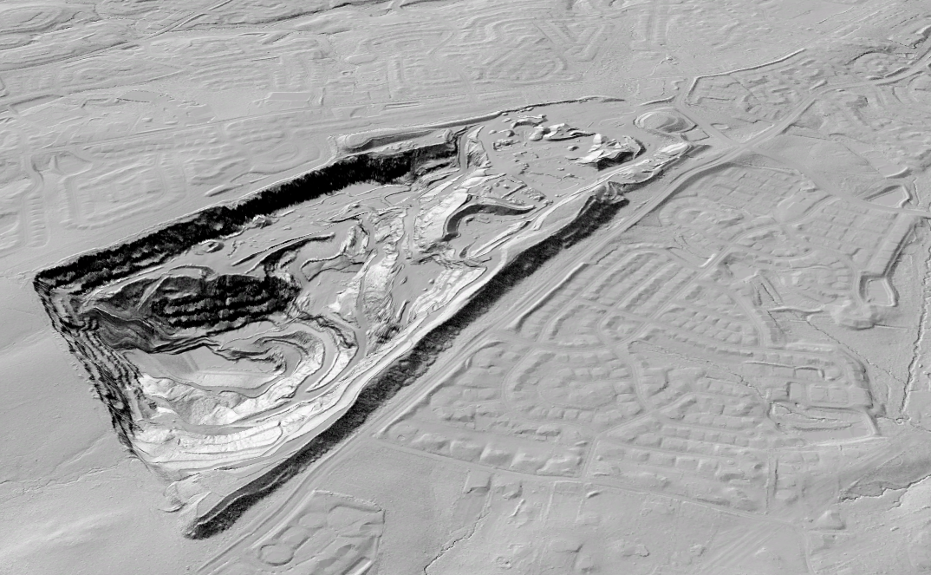
Digital Terrain Model (DTM)
A one-foot raster (each pixel represents a 1ft x 1ft area) of bare earth data, where surface objects such as trees and buildings are stripped away.
Download the countywide DTM raster (45 GB)
Download the countywide DTM shaded relief image file (12 GB)
To view the image service in ESRI’s ArcPro software, add the following link to your ArcPro project: https://montgomeryplans.org/server9/rest/services/Elevation/countywide_dtm/ImageServer
Digital Surface Model (DSM)
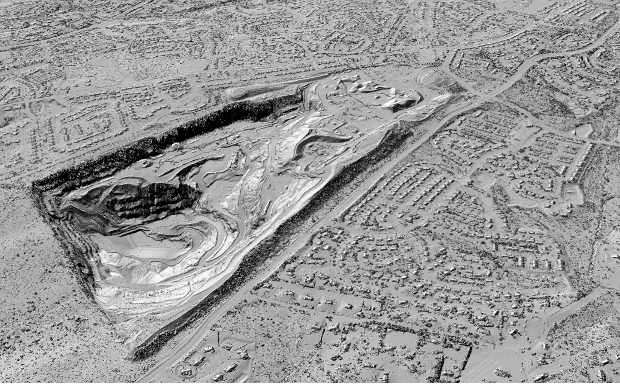
A one-foot raster (each pixel represents a 1ft x 1ft area) which includes all features on the surface, such as buildings, vegetation, and other structures, essentially capturing the elevation of everything above the ground, including both natural and man-made features.
Download the countywide DSM raster (42 GB)
Download the countywide DSM shaded relief image file (14 GB)
Normalized Digital Surface Model (nDSM)
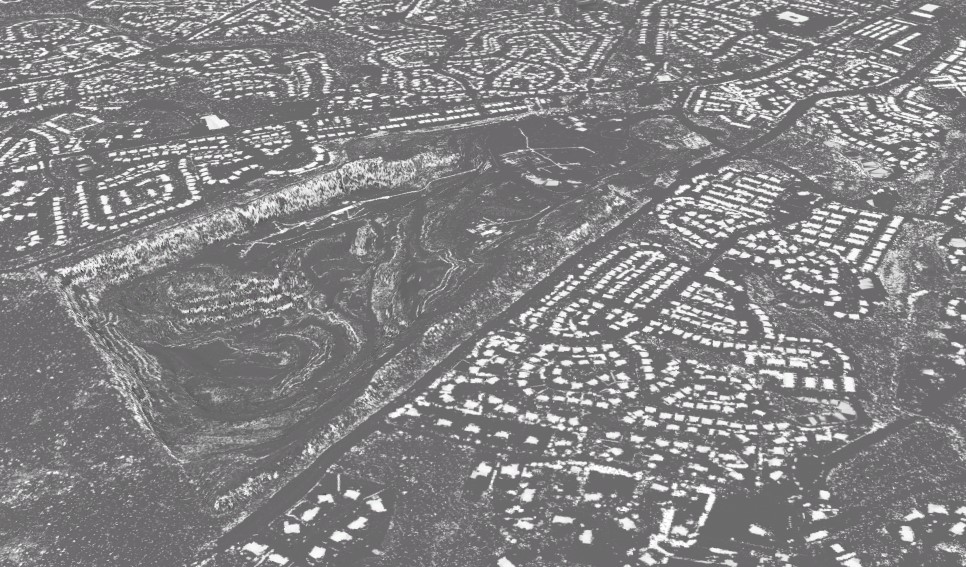
A one-foot raster (each pixel represents a 1ft x 1ft area) which models the difference in height between the bare earth and features on the surface. This raster is used to determine the heights of objects on the ground, such as building and tree heights.
Download the countywide nDSM raster (36 GB)
Download the countywide nDSM shaded relief image file (9 GB)
Steep Slope
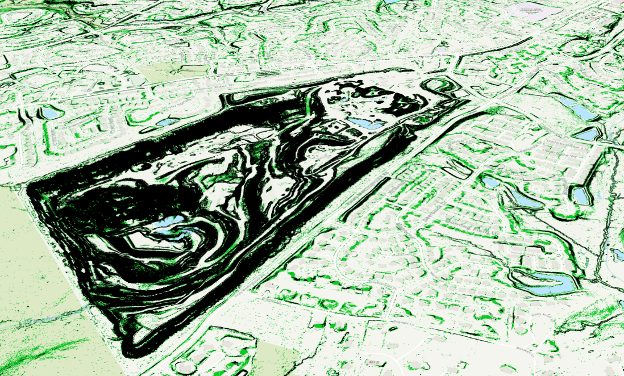
A one-foot raster (each pixel represents a 1ft x 1ft area) which captures the percent slope for a given area in one of three categories: Less than 15%, 15% to 25%, and over 25%. Percent slope represents the “rise” divided by the “run” multiplied by 100 (a numerical number) which is different from angle slope which measures the incline in degrees.
Contours
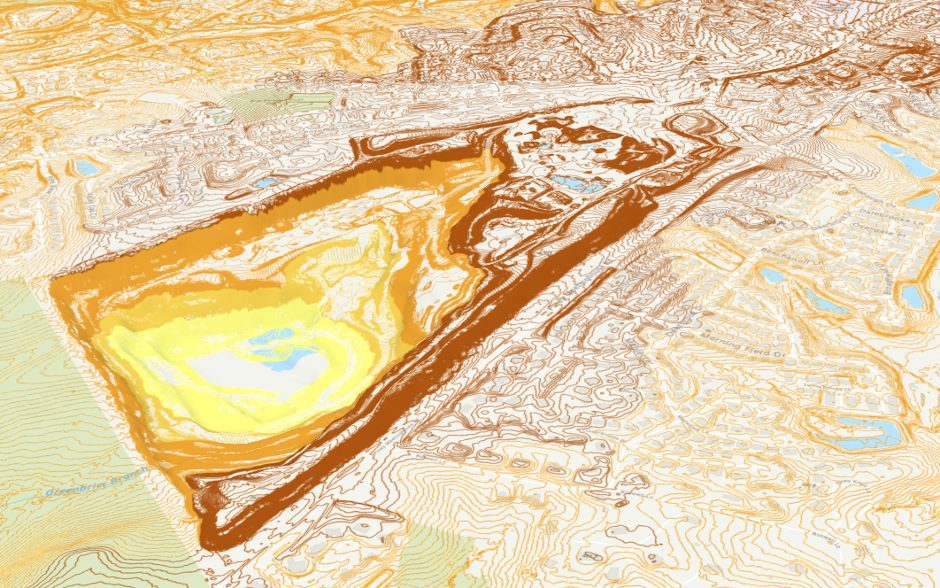
2-foot intervals contour lines created from LiDAR point cloud data.
Download the countywide contour GIS layer (857 MB)
Download the countywide contour GIS layer in dwg CAD format (3 GB)
For more information, contact:
GIS Manager Information Technology & Innovation (ITI)
Montgomery County Planning Department, MNCPPC
T: 301-650-5620