Plan Recommendations
The Plan recommends enhancing the existing transportation network with “complete streets” improvements to the roadway network that increase the connectivity, safety, and quality for all modes of transportation. These treatments were recommended for major corridors and key connectors including Wisconsin Avenue, Woodmont Avenue, Norfolk Avenue, and Arlington Road. Both short- and long-term cross sections were identified for these roads to safely accommodate pedestrians, bicyclists, motorists, and Wisconsin Avenue bus rapid transit (BRT). Separate projects were recommended to improve the bikeway network with both public and private funds.
Additionally, the Plan included policy recommendations that encourage non-driver travel modes. For example, the Transportation Management District (TMD) was confirmed and expanded from the 1994 Bethesda Central Business District (CBD) Sector Plan, which establishes and monitors the Non-Auto Driver Mode Share (NADMS).
The information provided below provides an update on the status of the recommended projects and policies that achieve the goals of the Sector Plan. As directed by the Council at the time of the Plan’s adoption, the report will cover the goals and recommendations in the approved and adopted Sector Plan in each report cycle but will provide detailed information on the status of the NADMS and Road Adequacy Test in alternating years. The Road Adequacy Network will be reported on in even-numbered years and an update on progress toward achieving the Plan’s NADMS goal will be covered in odd-numbered years.
Roadway Network Performance
The 2024 Annual Monitoring Report included an analysis of average vehicle delay at 16 key intersections within and surrounding the Plan area, as well as a traffic queuing analysis at 8 key intersections in the Plan area. As required by the Council with the adoption and approval of the Sector Plan, traffic analysis will be reported in the even years and the NADMS will be the focus of the report in the odd years.
Non-Auto-Driver Mode Share (NADMS)
Non-Auto Driver Mode Share (NADMS) measures the percentage of non-drivers arriving at a destination within a defined area during the peak period. This is referenced as NADMS-E (for “employees”) or “inbound commuters.” NADMS is also used to measure the percentage of residents living within a defined area who use non-driving modes to get to work, referenced as NADMS-R (for “residents”) or “outbound” commuters. “Non-driver” includes all commuters who arrive to work via “alternative modes” to driving, including transit, biking, walking, etc., and includes those who telework instead of traveling to a worksite. NADMS includes carpool and vanpool passengers but excludes carpool and vanpool drivers.
The NADMS goals for areas within the County are analyzed for both the two-hour (7 a.m.–9 a.m.) and three-hour (6:30 a.m. – 9:30 a.m.) peak-period morning commute times (aka “rush hours”). While goals for some areas originally focused on just the two- hour peak period, the analysis has been extended in recent years to include a three-hour period in selected reports, due to the increase in traffic volumes and congestion over a more extended peak period in many areas of the County.
Commuter surveys are conducted by the Montgomery County Department of Transportation (MCDOT), Commuter Services Section, on a biennial basis to collect peak-period travel (“rush hours”) information and information to assist the County in determining what factors most influence mode choices, and what additional programs or services should be considered to persuade more commuters to use alternatives to driving alone to work.
Data Collection and Current Methodology
Commuting Goals: The 2017 Bethesda Downtown Plan recommends a combined average goal of 55 percent NADMS for both employees and residents. The goal established in the Plan recognizes the potential traffic impacts of the large number of existing and planned multi-unit residential property developments in the downtown Bethesda area. While many future residents may either walk or bike to work or use transit due to their proximity to Metro and other transit options, it is expected there may also be an increase in outbound auto drivers from downtown Bethesda to other work locations.
Results: The MCDOT Commuter Survey results, cited at the time of Plan approval, indicated that the downtown Bethesda NADMS-E was approximately 42 percent (FY2013 survey). However, there is typically a wide variation in employer and employee participation and response rates to the survey from year to year owing to several factors. Any single year’s results should not be construed as representative of ongoing commuting patterns for the TMD as a whole– and the NADMS reported at the time of Sector Plan development (42%) is an outlier.
Variability of Results: Commuter survey response rates from year to year tend to be highly variable for several reasons. For many years, the Commuter Survey was conducted on an annual basis but was not distributed to the same group of employers each year. Instead, a subset of all employers of 25 or more employees within each TMD was selected for participation, alternating selected employers in succeeding survey years (except for very large employers) in order to avoid survey fatigue. In 2017, as a result of recommendations received from multiple sources including the County Council’s Office of Legislative Oversight, Commuter Services began requiring all employers of 25-plus in each TMD to participate on a bi-annual (alternating year) basis. This revised schedule provided the broadest reach within the business community while still addressing survey fatigue with intervening “off” years.
Another source of variability stems from the fact that within the same worksite, employee composition and commuting patterns change from year to year. Due to staff turnover, employees moving residences, and other life events, employee commuting modes at any given work site will change from year to year.
Commuter Services relies on employer contacts at work sites to distribute the survey to their employees. Typically, there are employer contacts (“Transportation Coordinators”) who are asked to distribute the survey at the worksite and to follow up with reminders and incentives to employees, but there is no way to compel employees to respond. Therefore, Commuter Services relies on on-site promotions, prize drawings (for transportation coordinators and respondents) and other incentives to achieve an adequate response rate.
Despite its limitations, the Commuter Survey has been the primary basis for evaluating commuting activity within the County’s TMDs, as it reveals more information about commuting at a small-area level than most other data sources. Data from the survey includes peak hours of commuting, mode of travel, ratio between cars and passengers (“average auto occupancy”), home origins of commuters, employer location and information on factors influencing mode choices. The survey gathers information on commuting patterns over the duration of a normal work week to get an accurate picture of daily commuting patterns. The results are analyzed for each employer and for all participating employers within each TMD survey area to assess progress toward achieving NADMS goals. Similar analyses are made of mode share for residents commuting from their homes to their respective worksites.
Analysis of Commuting Patterns in Downtown Bethesda
Residents: Bethesda’s combined 55 percent NADMS goal for employees and residents requires a comprehensive effort to survey residents living in downtown Bethesda. Bethesda Urban Partnership (BUP) coordinated with contacts identified in the Traffic Mitigation Agreements (TMAgs) with development projects to distribute and collect surveys – and with contacts under the Transportation Demand Management Plans required under recent County Code revisions. BUP is MCDOT’s contractor for TDM outreach in the Bethesda Transportation Management District. BUP operates Bethesda Transportation Solutions (BTS) for that purpose and has identified contacts for residential buildings and developed a marketing outreach strategy to reach residents throughout the downtown area.
The residential survey was conducted in the fall of 2022. The questionnaire asked respondents about their travel from the TMD to work or school during the two-hour peak (7–9 a.m.) and extended peak period (6:30–9:30 a.m.). NADMS-R for this time period is approximately 65.2%.
NADMS-Residents
| Year | Respondents | NADMS% |
|---|---|---|
| FY25 | N=408 | 65.2 |
Employees: The FY2025 Commuter Services employee commuter survey in the Bethesda TMD was conducted in 2025. That data, combined with prior years’ data, serve as the basis for analysis of “inbound” employee commuting. Bethesda’s employee commuter survey is conducted on an alternating year basis, using a similar survey instrument to the one used over the past several surveys.
The table below shows the most recent commuter survey response rates. The NADMS weighted average for employees for the last four surveys is approximately 43% (2-hr).
Employee Commuter Survey Results
| Year | NADMS% 2-Hour |
|---|---|
| FY18 | N=837 36.5 |
| FY20 | N=1,420 33.6 |
| FY23 | N=1,019 50.5 |
| FY25 | N=612 51.4 |
Bicycle and Pedestrian Connections
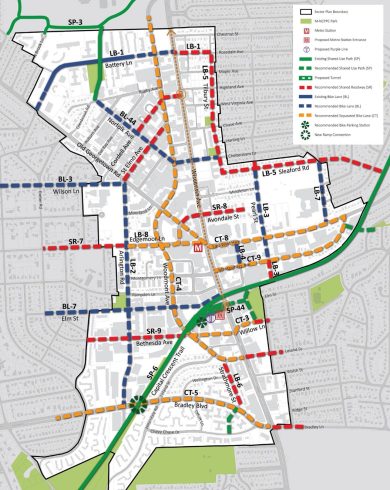
The Maryland State Highway Administration (MDOT SHA) designated the Sector Plan area as a Bicycle-Pedestrian Priority Area prior to the adoption of the Sector Plan. Montgomery County has a similar designation and the Sector Plan recommended that MCDOT recognize the Bethesda Downtown Sector Plan area as such. This designation from both agencies requires MDOT SHA and MCDOT to use best design practices to accommodate bicyclists and pedestrians through all phases of transportation planning.
All approved development will contribute to improving pedestrian and bikeway connections throughout the Sector Plan area. Several new bikeway recommendations were made for on-road and trail connections. Implementation of these projects will be funded and/or constructed by both public and private sources.
Traffic Demand Management
Implementing Traffic Demand Management (TDM) Plans is a means of reducing traffic congestion and automobile emissions and achieving other TDM goals, including the NADMS goals established by County Council in the GIP (formerly known as the “Subdivision Staging Policy”) and the Downtown Bethesda Sector Plan. TDM Plans, and their predecessor Transportation Management Agreements (TMAgs), are tri-party agreements (among MCDOT, M-NCPPC and the owner/developer) and commit the project to work with MCDOT to reduce the number of trips made by single-occupant vehicles into the TMD during the peak periods, to help achieve the NADMS goals adopted by Council for that TMD.
Capital Improvement Program Transportation Projects
| Project Name | Coordinating Agency | Status 2025 |
| Redesign Wisconsin Avenue as an urban boulevard | M-NCPPC/ MCDOT/SHA | Not funded |
| Redesign Old Georgetown Road as an urban boulevard | M-NCPPC/ MCDOT/SHA | Not funded |
| Redesign East-West Highway as an urban boulevard | M-NCPPC/ MCDOT/SHA | Not funded |
| Redesign Norfolk Avenue as a shared street | M-NCPPC/ MCDOT | On hold |
| Redesign Pearl Street as a shared street | M-NCPPC | Not funded |
| Pearl Street Connector | M-NCPPC/ MCDOT | Not funded |
| Capital Crescent Trail Surface Trail | SHA, M-NCPPC/ MCDOT | Phase 1 complete. Phase 2 construction to be completed in 2026 |
| Capital Crescent Trail Tunnel | SHA, M-NCPPC/ MCDOT | Project on hold due to fiscal capacity |
| Reconfigure East-West Highway, Montgomery Lane, Old Georgetown Road and Woodmont Avenue with separated bike lanes | M-NCPPC/ MCDOT | Montgomery Ave Phase 1, 2A and 2B complete Montgomery Ave Phase 2C construction begins in early 2026. Bethesda Two-Way Streets project was presented to the Planning Board on 9/14/2023. |
| Purple Line/Bethesda Station Construction | MTA/M-NCPPC/ MCDOT | Construction Underway |
| MD 355 South BRT from the Bethesda North Station to the Bethesda South Station to connect to the Purple Line | MTA/M-NCPPC/ MCDOT | Not funded |
| Bethesda South Bus Circulation | BUP | Not funded |
| Bethesda Circulator Bus Expansion | SHA/BUP | Not funded |
| Full-service bicycle storage facility located adjacent to the CCT tunnel routes | M-NCPPC | Funded for construction in FY28 |
| New separated bikeway lanes on Woodmont Avenue, Bradley Boulevard and Arlington Road | SHA, M-NCPPC, MCDOT | Woodmont Cycle Track Phase II – two-way cycle track from Norfolk Ave to MD 355 funded for construction in 2026 |
| Shared roadway on Commerce Lane, Avondale Street, Rosedale Avenue, Tillbury Street, St. Elmo Avenue, Cordell Avenue and Bethesda Avenue | M-NCPPC | Not funded |
| New trail connection at Bradley Boulevard and Capital Crescent Trail and Pearl Street | M-NCPPC | Not funded |
| North Bethesda Trail—widening | M-NCPPC, MCDOT | Not funded |
| Bike Share Station | M-NCPPC | Not funded |
| Undergrounding of public utilities | SHA, M-NCPPC | Not funded |
| New bike lanes on Chelton Road, Pearl Street, Norfolk Avenue, Cheltenham Drive, Elm Street, Battery Lane and Wilson Lane | M-NCPPC, MCDOT | Cheltenham Drive / Norfolk Avenue bikeway design to be completed in 2026. |
Parking
Nearly 8,000 parking spaces are provided by the Bethesda Parking Lot District (PLD) in garages, surface lots and on public streets. This number has not significantly changed since the adoption and approval of the Downtown Sector Plan.
MCDOT regularly surveys occupancies of its parking facilities. The table below shows the average occupancy rate over a three-month period from January 2022 to March 2023. The occupancies are collected during the mid-week, mid-day periods.
Parking Occupancy (Three-Month Period)
| Garage/Lot | Average occupancy | Capacity |
| Garage 11 | 49% | 1,079 |
| Garage 31 | 27% | 952 |
| Garage 35 | 69% | 366 |
| Garage 36 | 33% | 729 |
| Garage 40 | 70% | 311 |
| Garage 42 | 35% | 337 |
| Garage 47 | 37% | 796 |
| Garage 49 | 35% | 949 |
| Garage 57 | 54% | 870 |
| Lot 8 | 100% | 10 |
| Lot 10 | 55% | 94 |
| Lot 24 | 44% | 210 |
| Lot 25 | 27% | 124 |
| Lot 28 | 72% | 18 |
| Lot 44 | 33% | 51 |
| Total Garages | 42% | 6,389 |
| Total Lots | 43% | 507 |
| Total Occupancy | 42% | 6,896 |
Note: This table reports on the capacity and occupancy rate of paid parking spaces in a garage or surface lot. The figures in the table do not include spaces that do not require a parking fee, such as ADA accessible spaces.
Unified Mobility Program
The Unified Mobility Program (UMP) is a program proposed by the Bethesda Downtown Sector Plan as a funding mechanism for local infrastructure. As envisioned, it would have estimated the costs of local multi-modal infrastructure needed to achieve the plan objectives and then assessed those costs as a fee on new development. However, the viability of such a fee on new development was affected by the rapid advancement of new development before the fee could be implemented, and the fee on remaining development would have been too high to be feasible for this financing structure. Therefore, on April 4, 2022, the County Executive sent a memo to County Council that MCDOT was no longer developing the Bethesda Unified Mobility Program (BUMP). Instead, a working group will explore alternative financing and funding mechanisms.