
A conversation with Montgomery Planning’s “equity data team” on the award-winning Equity Focus Areas analysis and story map
By Pamela Zorich, Jay Mukherjee, and Karen Blyton
Montgomery Planning is committed to eliminating racial inequities and creating equitable communities within Montgomery County. One key part of this work is the Equity Focus Areas (EFA) analysis, created by our Equity Data Team. The team recently won a 2021 Data Viz Award from the Association of Public Data Users for their story map created to illustrate their findings.
We sat down with two members of the Equity Data Team, Pamela Zorich and Jay Mukherjee, to discuss their work on this analysis, how it may help create a more equitable Montgomery County, and what they hope to see for the future of their research.
What are Equity Focus Areas?
Pamela Zorich (PZ): Equity Focus Areas are parts of Montgomery County characterized by high concentrations of lower-income households, people of color, and individuals who may speak English less than very well. The Equity Focus Areas (EFA) analysis is tailored to Montgomery County examining these specific variables associated with identifying marginalized populations. Montgomery Planning developed a data-driven tool to identify and map these areas in the county to assess potential racial and social inequities. This includes access to resources and opportunities for employment, transportation, education, health, and government services that support a good quality of life.
When and why did you start researching Equity Focus Areas?
As community planners, it is important for us to understand the disparities among communities; county level analysis is not enough.
PZ: We recognized the need for identifying and understanding vulnerable populations in the county during Equity Working Group discussions for Thrive Montgomery 2050, the update to the General Plan. We know access to opportunities and resources is an uneven landscape in the county and it varies by place, race and ethnicity, and income. As community planners, it is important for us to understand the disparities among communities; county level analysis is not enough.
A spinoff of technical staff, Jay Mukherjee, Susanne Paul, and I, formed the Equity Data Team to create this EFA analytical tool based on the analysis of three core equity variables to define the highest concentrations of vulnerable populations. While other regional and national analysis is available such as the regional model, “Equity Emphasis Areas”, developed by Metropolitan Washington Council of Governments, Montgomery Planning’s EFA project devises a methodology using local data and performs equity analysis specific to Montgomery County. An equity analysis tailored to Montgomery County provides a more representative, local assessment.
Jay Mukherjee (JM): The EFA concept was developed to be used as a “screening tool” by planners. For example, our Countywide Planning & Policy group used the EFA for their Travel Monitoring Report by looking specifically at the impact of congestion and transit coverage within and outside the EFA. By using this tool, it was ascertained that EFA achieved higher quality coverage and higher transit coverage than non-EFA areas. This tool was also used by our Park Planners via the Energized Public Spaces (EPS) program to determine whether parks and public spaces are being served to the areas of the county most in need. Using the EFA in an analytical way reinforced to the Parks Department whether goals of the EPS are being achieved.
It also reinforces Montgomery Planning’s commitment to transforming the way we work as we seek to address, mitigate, and eliminate inequities of the past and develop planning solutions to create equitable communities in the future through our Equity Agenda for Planning.
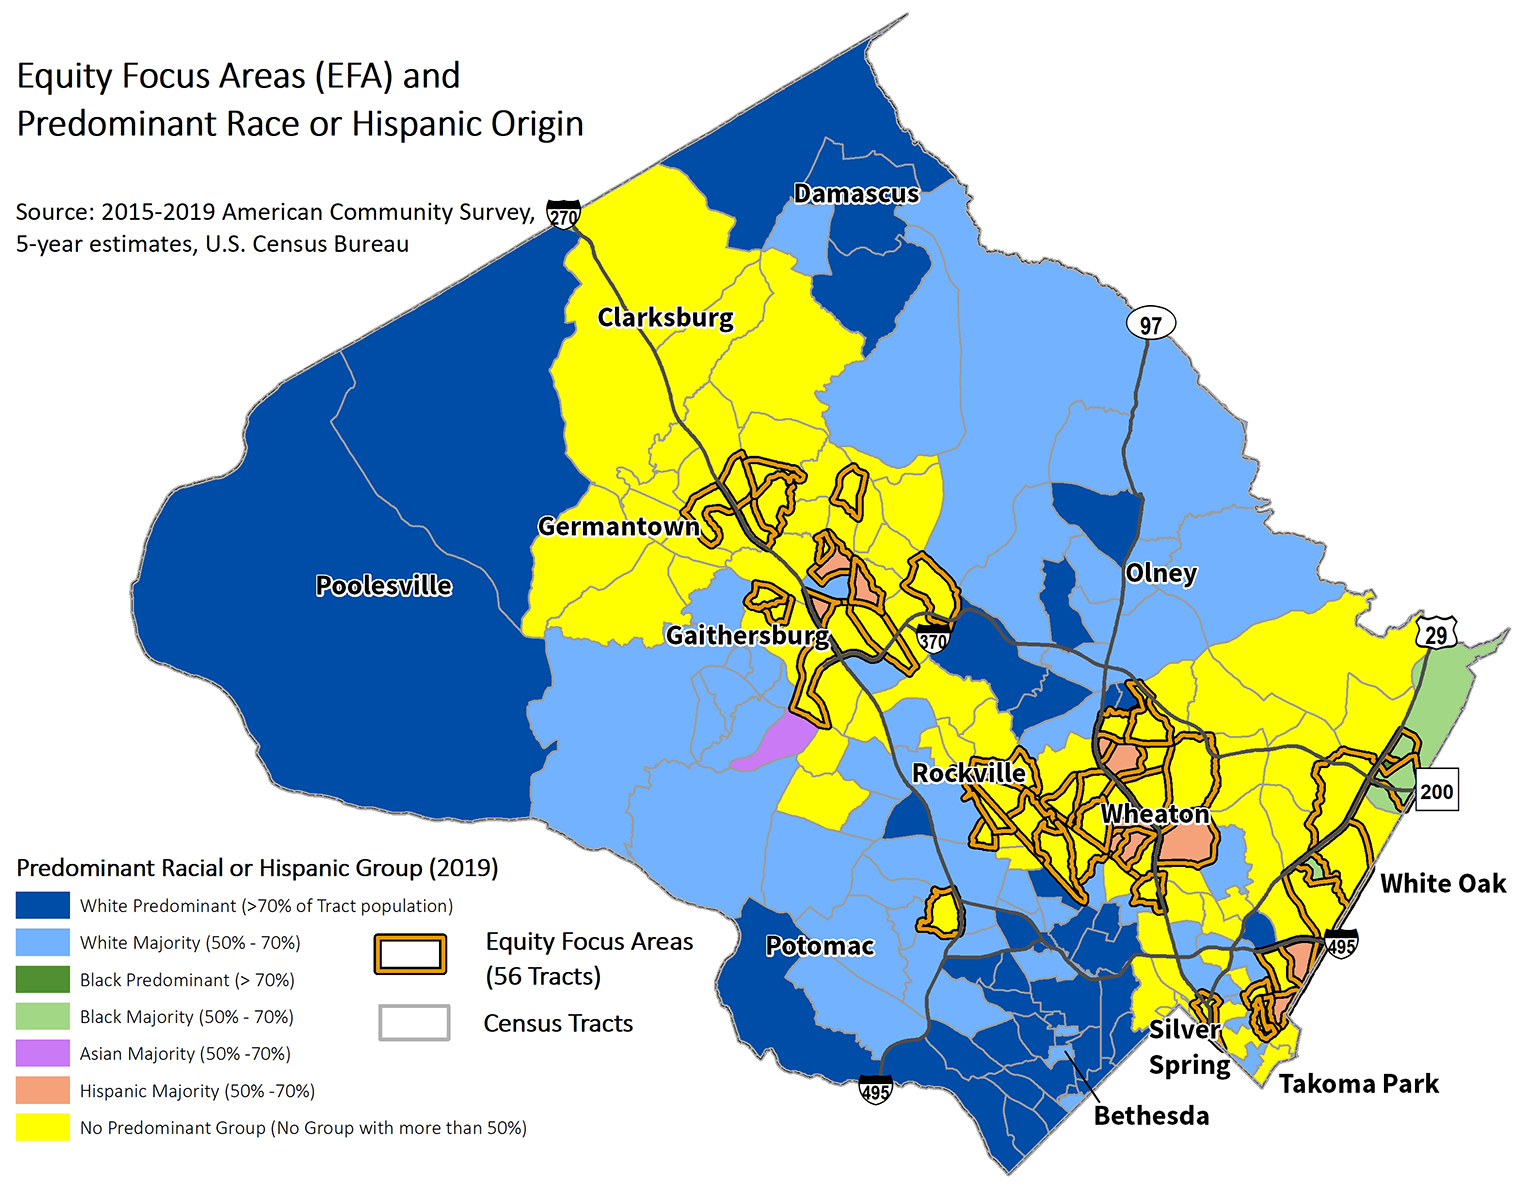
Map of Montgomery County highlighting Equity Focus Areas and Predominate Race or Hispanic Origin.
What were your findings?
PZ: Approximately one-quarter of the county’s population (276,000 people) live in Equity Focus Areas primarily located mid-county, in Aspen Hill and Wheaton areas along Route 29; near Germantown and Gaithersburg along I-270; and the eastern portion of Down-County abutting Prince George’s County.
Compared to the county overall, the population in EFAs is younger, has a lower educational attainment level, and is more likely to be Hispanic. One-third of the EFA households have incomes under $50,000 making housing costs burden more likely. Households in EFAs are less likely to be owner-occupied and the median housing value is two-thirds of the value countywide. Additional characteristics are described in the demographic profile of the Equity Focus Areas.
What did you personally learn from doing this research?
The EFA analysis revealed “surprises” as to identifying areas that went against our preconceived notion of EFA areas
JM: The EFA analysis revealed “surprises” as to identifying areas that went against our preconceived notion of EFA areas which could not have been uncovered without creating this analysis or by just knowing and living in Montgomery County. We could then use these areas to dive deeper to learn how they are composed and what caused them to be different than we expected, thereby learning even more about Montgomery County and the forces of inequity within our county.
How might this analysis help make Montgomery County a more equitable place?
PZ: Identifying Equity Focus Areas helps direct planning efforts to better understand and engage with communities that may not have equitable access to resources or opportunities. This will facilitate bringing racial equity and social justice considerations into the master planning process so that Montgomery Planning can produce master plans that will foster more equitable outcomes for communities in Montgomery County.
The EFA analysis helps guide numerous projects and processes of the Montgomery Planning and Montgomery Parks. Some of these efforts include the update to the county’s General Plan known as Thrive Montgomery 2050; Montgomery Planning’s Equity in Master Planning Framework and master and sector plans; Montgomery Parks’ Capital Improvement Program prioritization and other parks, trails or facility-specific strategic planning efforts.

Screenshot of the Equity Focus Areas Story Map.
What is the Equity Focus Areas Story Map and what was your motivation behind creating this?
JM: Story maps, like the Equity Focus Areas Story Map, are a fun and creative way to communicate concepts to the wider public via the web. They are essentially electronic encyclopedias where maps, graphics and narrative texts can be used to tell a story, in this case the story of the EFA. We did not want to just inform and educate, but we also were interested in inspiring the public. The story map concept is uniquely suited to do that type of thing.
PZ: While the story map was created to explain the technical concepts for developing the EFAs, it also provides a forum to acknowledge the role that Montgomery Planning’s plans and policies have played in creating and perpetuating racial inequity in Montgomery County. It also highlights our efforts to address, mitigate, and eliminate inequities of the past and develop planning solutions to create equitable communities in the future.
Tell us about your recent award win for the Equity Focus Areas Story Map.
PZ & JM: We are so proud that our team’s Equity Focus Areas Story Map won a 2021 Data Viz Award from the from the Association of Public Data Users.
Our Equity Data Team created the EFA story map during the pandemic without meeting in person including adding a new team member, Shruti Punjabi. Shruti’s incredible contributions helped us win a Data Viz Award from the Association of Public Data Users. Susanne and Shruti have moved on from Montgomery Planning, but we still maintain our team bond and occasionally get the original EFA band virtually back together.
What kind of feedback have you received on this research from the Montgomery County Planning Board, for example, or other county agencies?
PZ: We have received very positive comments and valuable insight from the Planning Board while the EFAs were being developed and at the presentation of the results last spring. We have also given presentations to several county agencies who have since expressed an interest in incorporating the EFA analysis into their budget process and other projects.
JM: We are excited that several planners have expressed an interest in applying the EFA analysis to community planning, transportation, and parks projects. We will be working with community planners to incorporate analysis in active plans overlapping EFAs such as the Fairland and Briggs Chaney and the Silver Spring Downtown and Adjacent Communities plans. Another example is Forest Conservation staff is exploring using EFAs to prioritize applications for the Reforest Montgomery free shade tree program.
What do you hope to see for the future of this research? Will you continue to add to this analysis over time?
JM: We are planning on adding to the EFA analysis by illustrating the different ways EFAs are being used in an online map gallery. The map gallery will serve as a warehouse where the public and/or other planning professionals can visualize the types of analysis people have performed using EFA in the environment, demographics, transportation, economic and health conditions realms. In addition to visualizing, the map gallery will explain the analysis and provide access to the data. This data can then be used by the public to do their own analysis.
PZ: Applying what we have learned from developing the EFAs will also serve as a springboard for creating an Equity Index, a more robust, multi-variable modeling approach to assess state of socio-economic advantage and disadvantage across Montgomery County. Data describing existing conditions, such as household income, race and ethnicity, employment, housing affordability, access to parks will be indexed to develop scoring measures of advantage to make it easier to compare different areas.
 About the authors
Pamela Zorich is a Research Coordinator in Research & Strategic Projects at Montgomery Planning. In this role, she tracks local, regional, and national demographic trends, and quantifies growth and socio-economic changes in Montgomery County. Pamela recently led the Equity Working Group in updating the county’s General Plan, Thrive Montgomery 2050. She is currently leading the Equity Data Team in developing analytical equity tools such as the Equity Focus Area Analysis and the Equity Index for Montgomery County.

Jay Mukherjee is a Principal GIS Specialist with the Information Technology and Innovation Division Montgomery Planning, where he has worked for the past 15 years. He has over 22 years of experience using Geographic Information System (GIS) technology in the land use, zoning, and property mapping environment. Prior to Montgomery Planning, Jay worked in a similar role for the Santa Clara County (CA) Planning Department. With a master’s degree in Environmental Science and GIS, he has always had a keen interest in using geospatial technology to highlight both the human dimensions of global change and social justice issues.

Karen Blyton is a Content Manager for Montgomery Planning’s Communications Division. In this role, she develops communications materials for Montgomery Planning’s website, social media channels, eLetters, and blog to help engage the community in the planning process. She brings with her 10 years of communications experience from a variety of non-profit and governmental organizations, such as the DC Sustainable Energy Utility, the Association of American Medical Colleges, and most recently, RTI International. She has a Masters of Professional Studies in Public Relations and Corporate Communications from Georgetown University.
Dipak mukherjee
It reminds..the study done by natasha mukherjee..in south africa..before mandela was made the president..it was about the equitable water distribution..in previous apartheid era..water resource was for the white minority..among other needs..plenty of water for luxury item..like swim pools for the whites..after mandela…there was equitable water resoures for…for the farmers…that there is water for ..among other …for agriculture…imporatant for community. food supply…and then for pleasure…such as swim pool etc
Cary Lamari
The Equity Focus map is interesting as I consider the Attainable Housing Initiative. It appears if one overlays Active Communities and The Transportation corridors as it relates to the EFM It appears most populations in need of affordability could be destabilized with the ATI. This new paradigm of growth encourages property owners who rent their units in these areas could potentially profit by displacing the current families and rebuild their properties to 3 and 4 unit bldgs. The newer units presumably would be more expensive creating a different demographic as an outcome. IMO the ATI initiative should not be used in such areas as it creates more need for affordable housing and could create flight of these populations to Prince George’s County and beyond to find housing which rents for rates similar to where they lived in these EFA communities. The New York Studies relied on by the Brookings institute suggests where up-zoning is implemented that the demographics change to primarily white and asian. I would hope the Planning staff considers this and potentially does an analysis considering this phenomena on up-zoning.