People are often nervous about large redevelopment plans in their neighborhoods. This wariness is understandable because there is a long history of redevelopment and exclusionary practices directly and indirectly displacing people—often people of color.1
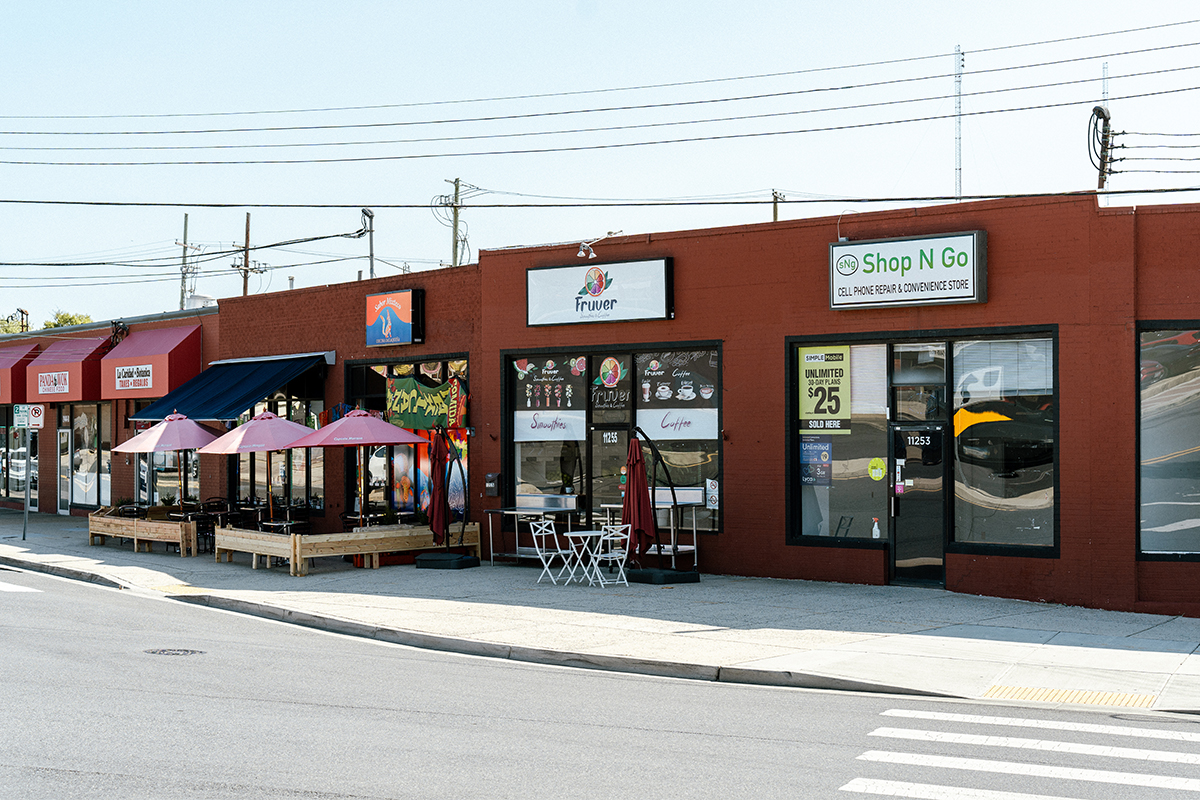
Downtown Wheaton, Md.
As Montgomery Planning continues to work with the community reenvisioning some of its mature neighborhoods like eastern Silver Spring and corridors like University Boulevard a retrospective look at some recent notable redevelopments could address some of these concerns and provide lessons for current and future plans. This analysis highlights two key facts about redevelopment plans in Montgomery County.
- Some of the county’s most notable redevelopment efforts have produced equitable and inclusive growth.
- In neighborhoods and corridors where evolution is stalled, the alternative to redevelopment is decline.
While the prospect of redevelopment and new investment can feel scary, decline is a more serious threat and the more urgent issue for Montgomery County. As our Neighborhood Change in the Washington, DC Area Study showed, more people and neighborhoods in Montgomery County are experiencing low-income concentration than displacement.
Two master-plan-inspired redevelopments from the last 25 years in downtown Silver Spring and downtown Wheaton help to illustrate these dynamics in Montgomery County.
Downtown Silver Spring
One of Montgomery County’s largest-scale redevelopments ever was in downtown Silver Spring following the Silver Spring Central Business District Plan in 2000. As the Neighborhood Change Study showed, measurable residential displacement was avoided in downtown Silver Spring. The increased housing opportunities and public and private investments called for by the plan paved the way for significant increases in residents of all income levels—including low-income—as well as all racial and ethnic groups.
Figure 1: Demographics of downtown Silver Spring residents before (2000) and after (2019) the 2000 Plan
In the “Neighborhood Change” framework, when a neighborhood gets wealthier, sees increased private investment, and welcomes more low-income people—as downtown Silver Spring did—it is called “inclusive growth.”
Wheaton Central Business District
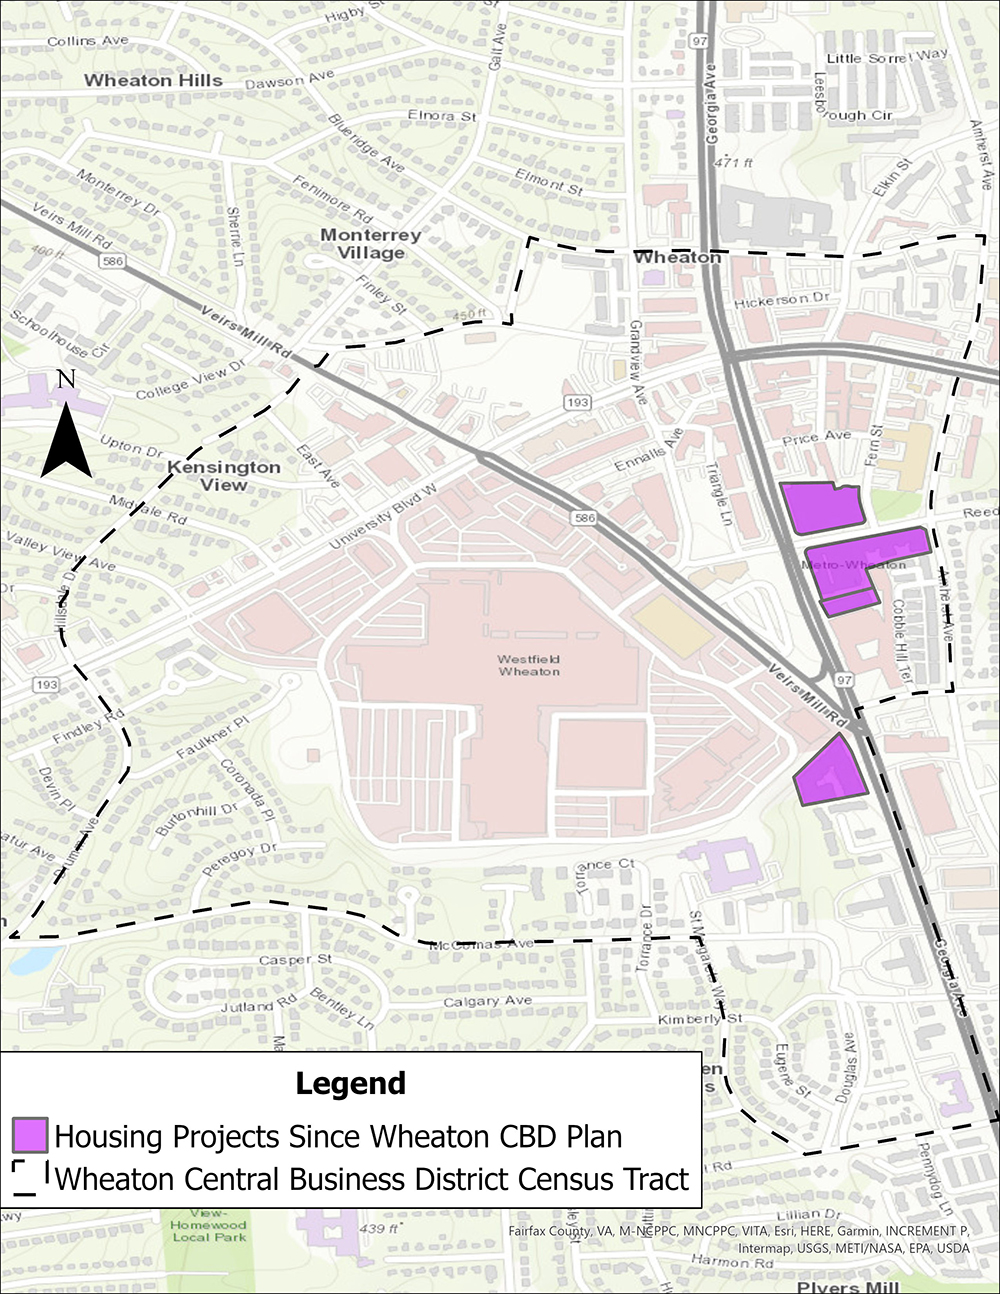
The 2012 Wheaton Central Business District (CBD) and Vicinity Sector Plan expressed a similar vision of revitalization for downtown Wheaton. For analysis purposes, we use Census Tract 7038.00 to represent the Wheaton CBD (see Figure 2).
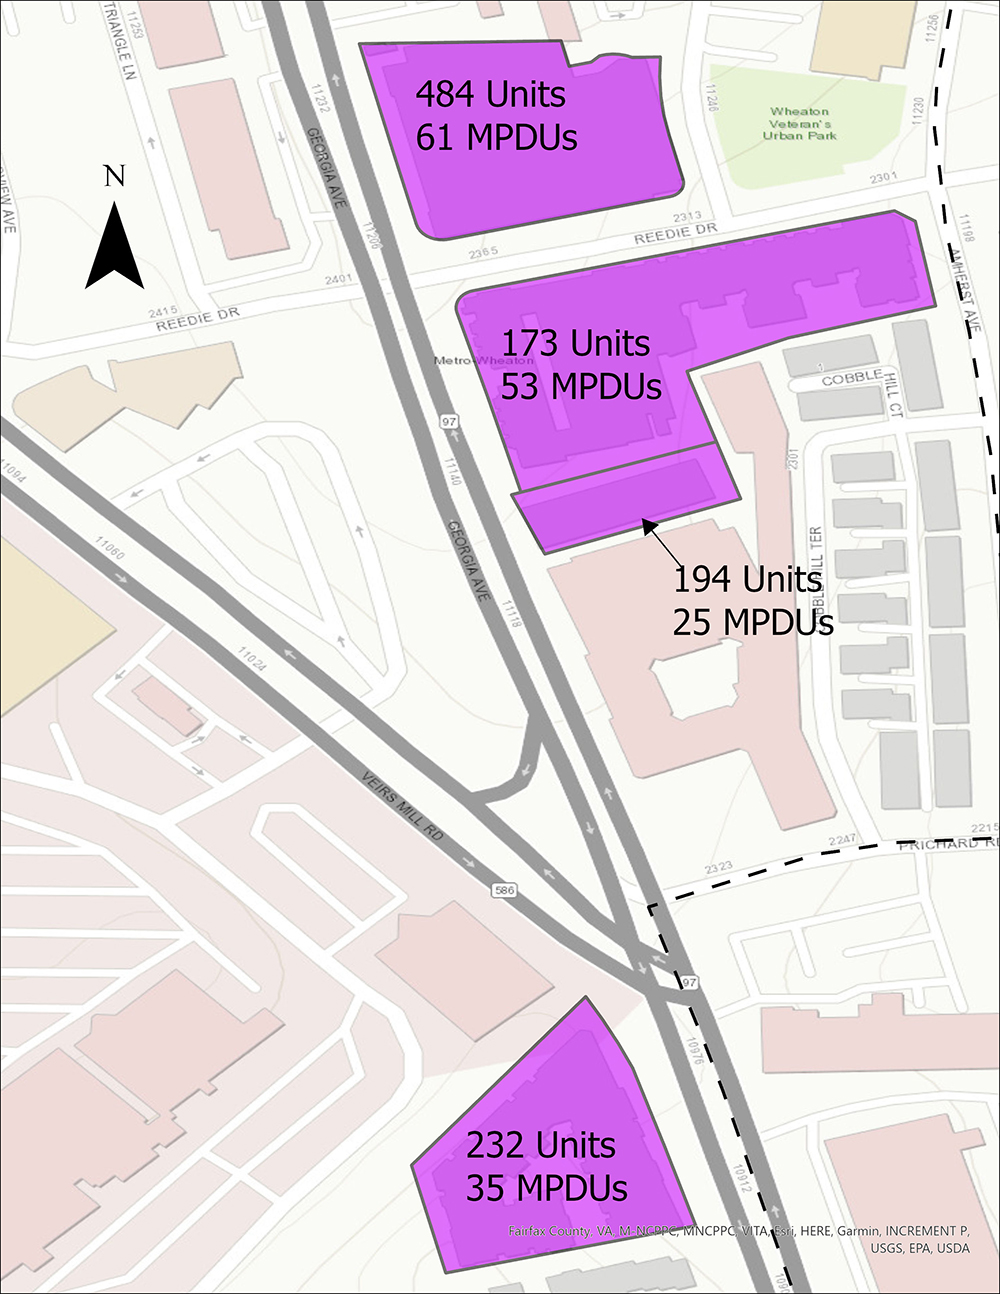
First, the plan added much-needed housing. Since 2009, four new multi-family residential buildings were built (all except Metro Pointe after the 2012 Plan’s adoption), adding 1,080 units2 (see Figure 2) without displacing a single resident. All the sites were previously occupied by obsolete institutional, office, or other commercial buildings. The project now called “The Exchange” replaced the existing Safeway supermarket with a brand new one on the ground floor of the building.
These projects also added 174 Moderately Priced Dwelling Units (MPDUs) (Figure 2), which have their rents capped based on tenants’ incomes for 99 years.
Figure 2: Map of Wheaton CBD with four housing projects
In terms of demographics, the downtown Wheaton Census tract also increased or maintained pre-2012 levels of residents of all income levels, races, and ethnicities. According to the U.S. Census Bureau’s American Community Survey, the Hispanic/Latino population remained essentially the same,3 while the non-Hispanic White population grew slightly. The African American population more than doubled.
Additionally, the number of low-income people, defined as those living at or below twice the federal poverty level ($60,000 for a family of four in 2023), increased by 43% (about 330 people). All the while, the higher-income population—those living above twice the federal poverty level—increased by 38%, or about 800 people.
Figure 3: Demographics of residents before (2012) and after (2023) Wheaton CBD Plan
One of the reasons Wheaton has been able to grow equitably is because rents have remained relatively low. Even the market-rate units in these new buildings are technically “affordable” according to the county’s income guidelines. The weighted average monthly rents in these buildings are $2,798 for three-bedroom units and $2,363 for two-bedroom units according to the most recent data.4 While these rents are still unaffordable to the lowest-income families, the three-bedroom units are, on average, affordable to households earning 72% of the county’s 2024 area median income (AMI) for a family of four, and the two-bedroom units are affordable to households earning 61% of the AMI, meaning they are within the county’s income limits for housing programs. In other words, market-rate rents in these new buildings are competitive with what many tenants pay in the county’s restricted affordable housing programs.
Rents for the entire Wheaton-Kensington submarket (all bedrooms and unit sizes) are even lower, averaging about $1,950 per month in 2024. As of the last quarter of 2024, inflation adjusted monthly rents in the submarket are almost $400 lower than they were ten years ago.5
Balancing growth and inclusivity with revitalization
The 2012 Plan’s vision for Wheaton has been successful in its goal of encouraging equitable housing development in a commercial district with a Metro stop. An influx of new units and a period of relatively low rents in Wheaton have allowed a diverse group of people to call it home.
But it also illustrates a challenge. Aside from the residential projects mentioned above, the new municipal building that serves as the Maryland-National Capital Park and Planning Commission’s Wheaton Headquarters, and the Marian Fryer Town Plaza, Wheaton has experienced commercial disinvestment since the 2012 Plan. Between 2010 and 2023, the Wheaton CBD lost about 90 private business establishments and 970 jobs.6 Businesses that move or close because of an environment in which they can’t be profitable are also “displaced” even if rents aren’t rising and buildings aren’t being redeveloped. While it’s impossible to say what would have happened to these businesses without the investments that came along following the 2012 Plan, it’s likely that remaining businesses benefitted from the influx of residents and public employees brought by redevelopment.
This trend illustrates the difficult needle to thread when looking to revitalize a neighborhood or corridor. Real estate values must remain low enough on average to be affordable, but high enough to spark investment to support new people and new businesses.
The reality is that even with new housing and public investment, neighborhoods and corridors like Wheaton, University Boulevard, and eastern Silver Spring may still fail to attract private investment. Limiting or preventing investment in the name of neighborhood preservation will only preserve the existing state of stagnation. Welcoming thoughtful investment is the best chance to change this trajectory for current and future residents.
1 Montgomery Planning’s Mapping Segregation project addresses the history of restrictive covenants generally and in Montgomery County, and provides references to other historical practices of racial and ethnic exclusion.
2 The recently approved Wheaton Gateway sketch plan, located just outside the Wheaton CBD, anticipates adding as many as 800 units with 30% MPDUs on a site that will also not result in any residential displacement. In addition, AVA Wheaton, completed in 2017 also just outside the tract boundary on Georgia and Blueridge Avenues added 319 units including 41 MPDUs.
3 The six tracts immediately adjacent to the Wheaton CBD saw their combined Hispanic or Latino populations increase by about 770 people between 2012 and 2023, an 8% increase which accounts for 40% of the combined net population gains of the tracts. One of the tracts had a slight boundary change in 2020, but this was not factored into the analysis.
4 Effective rent data from CoStar; weighted average based on number of units in each building.
5 CoStar Inflation-Adjusted Property-Level Market Rent Per Unit
6 Montgomery Planning analysis of MD Dept. of Labor Quarterly Census of Employment and Wages microdata. These jobs and establishment numbers should be treated as estimates and not exact counts.

About the author
Benjamin Kraft is a research planner in Montgomery Planning’s Research and Strategic Projects Division. His research and planning work focus on topics related to the economy and employment. Ben has a Ph.D. in city and regional planning from Georgia Tech and a master’s degree in urban planning from the University of Michigan.