Part 1 of this blog series used data from the Opportunity Insights project to show that children raised in Montgomery County were able to move further up the economic ladder than children growing up in other parts of the United States. However, the blog also showed that there is a strong correlation between economic mobility and race and ethnicity, and it suggested that, depending on how the population is divided, the prosperity of places does not always coincide with the prosperity of the people living in them. This blog explores these issues in more detail by focusing on the county’s neighborhoods and shows that economic mobility across the County and within neighborhoods differs significantly based on race and ethnicity.
If you’re not familiar with the Opportunity Insights data and methodology, now is a good time to read the “The Opportunity Insights Approach to Measuring Economic Mobility” section in Part 1.
A Closer Look at Economic Mobility in Montgomery County
The two maps below show differences in mobility in Montgomery County’s neighborhoods (represented by census tracts) based on race. Both maps show outcomes for children raised at the 50th percentile—the middle of the national household income distribution.
Maps 1 and 2: Average Adult Household Income Percentile for Children in Montgomery County Whose Parents were at the 50th Percentile of Household Income by Race
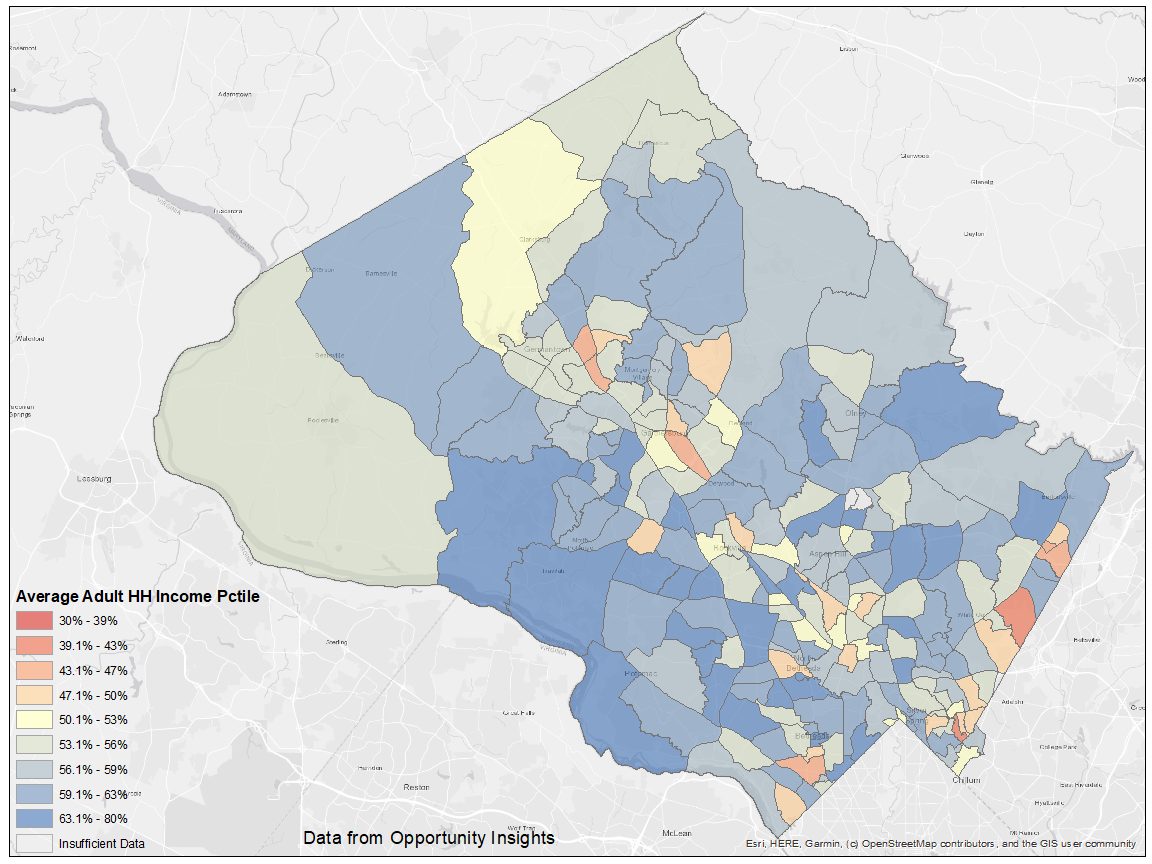
Map 1: White children
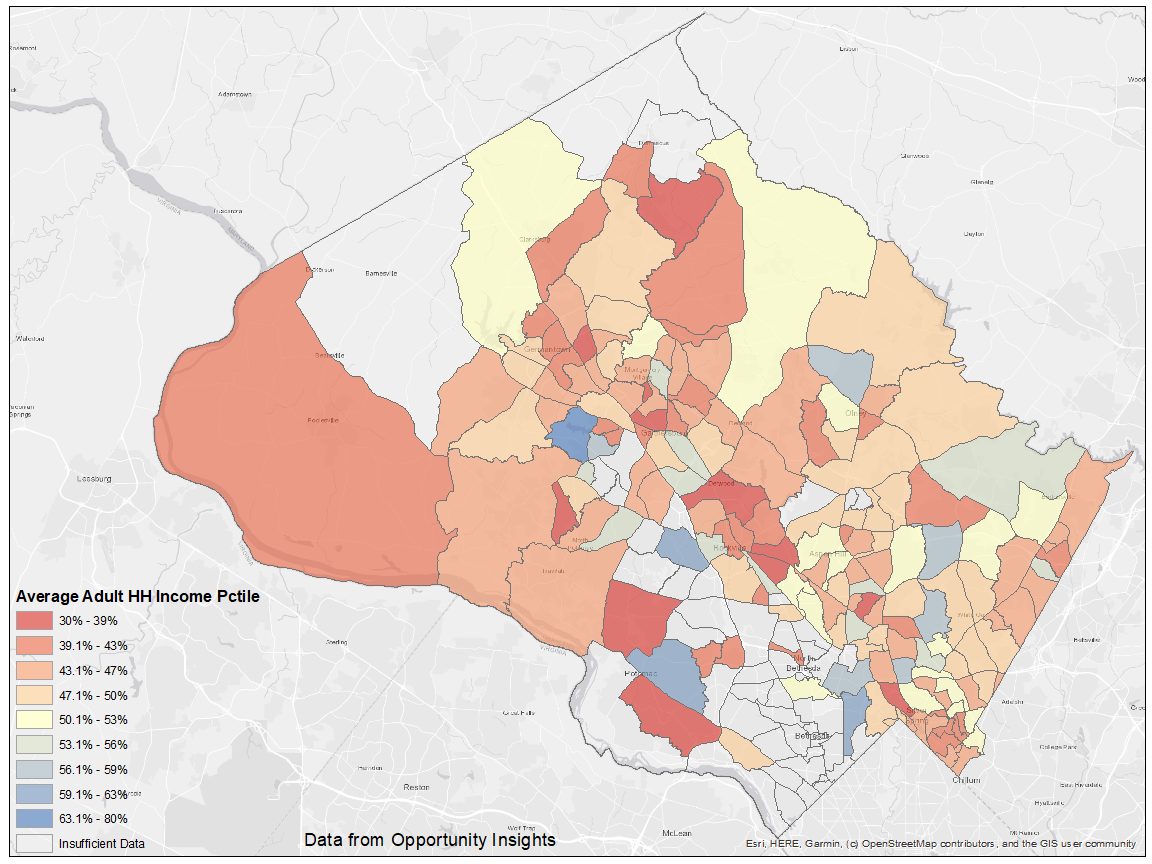
Map 2: Black children
Although the maps look very different from each other, they use the same color scale where yellow indicates that the average child who grew up there went on to occupy the same or a slightly higher position on the national income distribution as her parents by the time she reached her mid-thirties. In green and blue tracts, children tended to surpass their parents’ positions, while in orange and yellow tracts they tended to fall below it.
The much “bluer” Map 1 shows that economic mobility for white children is generally high regardless of the neighborhood where they were raised. While there are some tracts in Map 1 where white children have fallen below the median (50th percentile) household income as adults, in 187 out of 2131 tracts (88%), those who grew up there preserved or enhanced their childhood economic status.
As noted in the previous blog, some downward mobility is normal and necessary because otherwise, nobody would “change places” and upward mobility would be impossible; people’s economic destiny would be determined entirely by the status of the family into which they were born. Downward mobility becomes a problem when it disproportionately affects specific geographies as shown in Map 1, or races as shown in Map 2.
Map 2’s “redder” hues indicate that Black children raised at the 50th percentile face much higher roadblocks to achieving economic mobility. In fact, Black middle-class children raised in most neighborhoods in Montgomery County were much more likely to experience downward mobility than upward mobility; out of the 166 tracts where enough Black children grew up to calculate the mobility metric, Black children raised at the 50th percentile have fallen to the bottom half as adults in 125 (75%) of them. Only the remaining 41 tracts (25%) produced upwardly mobile Black middle-class children. There were only 11 total Montgomery County tracts from which Black children went on to earn more than white children raised in the same tract at the 50th percentile of household income.
It is important to emphasize that these starkly different maps show outcomes for children who grew up at the same income level, so it compares children who likely went to the same schools and grew up in the same economic class. Thus, the comparison leaves little beyond structural racism and discrimination to account for the difference in economic mobility between races. Also note that the areas without shading on the map are those in which too few black children grew up to generate reliable estimates or to permit disclosure of their outcomes without compromising their identity. These 47 “gray” tracts could in part reflect historical patterns of segregation where minority residents were steered towards living in other parts of the region.
Economic Mobility and Neighborhood Change: Do Neighborhood Improvements Increase Economic Mobility?
At Montgomery Planning we often work at the neighborhood scale, and the time horizons for our plans are often the span of time it takes for a child to grow up in one of these neighborhoods. The disparate economic mobility outcomes for different neighborhoods, races, and ethnicities in Opportunity Insights data raise the question of whether there is a relationship between neighborhood change and economic mobility. We can ask ourselves more directly, “can our area plans help improve the economic prospects of residents in an equitable way?”
To begin to answer this question, let’s start with the census tract 7028.002 (outlined in red below), which includes the neighborhoods of Woodside, North Woodside, and Montgomery Hills. This tract has done well between 1990 and 2016, seeing a $21,000 increase in median household income—much higher than the county’s overall increase. White children who grew up in this tract at the 50th percentile of the national income distribution also did well. They had average adult household incomes of $55,545, meaning they moved up to about the 60th percentile nationally when they reached their thirties.3
Map 3: Montgomery County Census Tract 7028.00
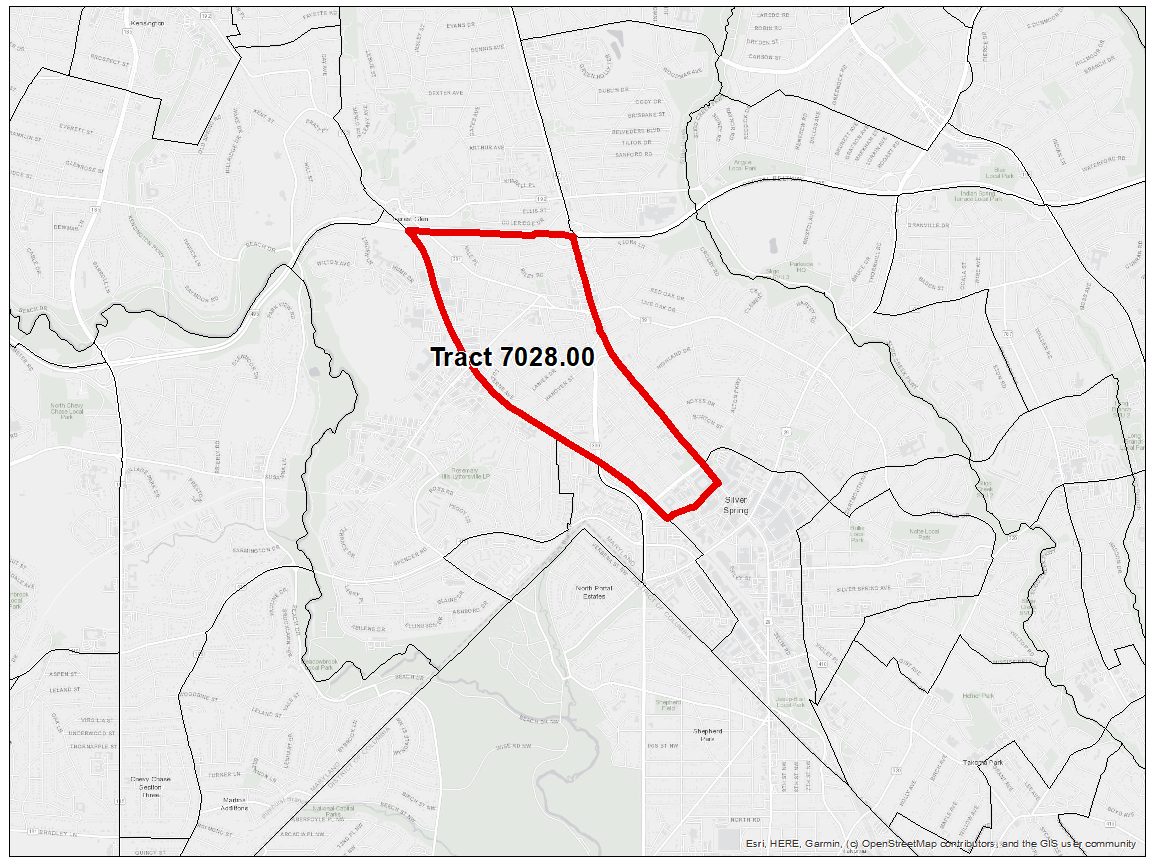
However, Black children growing up in the same neighborhood at the same income level had an average adult household income of only $28,768, moving on average down to the 38th percentile. While the neighborhood was increasing its status and prosperity and provided a solid economic springboard for white children, the Black children who grew up there were falling behind.
This is not unique in Montgomery County. Of the county’s 215 Census tracts, 118 saw their median household incomes increase from 1990 to 2016, which is roughly the time tracked by the Opportunity Insights mobility metric. Out of these increasingly prosperous tracts, 107 tracts (91%) saw the white children who grew up in them (at the 50th percentile of household income) reach on average at least the same level as adults. However, only 76 (64%) saw Hispanic children reach this threshold, and only 23 (19%) helped keep Black children to the top half.4 Returning to the question above—whether neighborhood improvement increases economic mobility—the answer from this analysis would be: yes, but only for some.
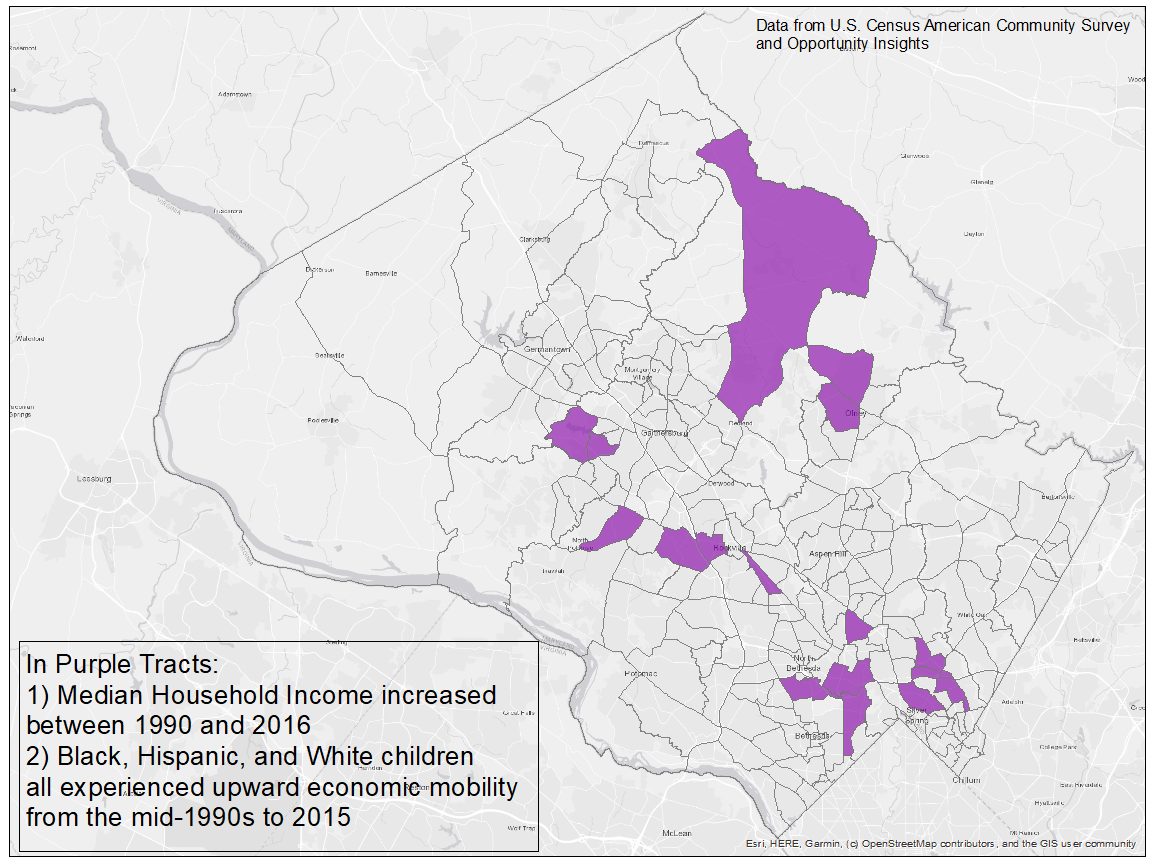
Only 17 tracts in the county appear to have generated broadly shared prosperity and mobility. These tracts, shown in purple in Map 4, are those in which median household income increased between 1990 and 2016 and whites, Blacks, and Hispanics were all upwardly mobile over roughly the same period. While it is discouraging that there are so few of these tracts—and there is unlikely to be any “magic” formula that led to increasing prosperity for all groups in these places—it may be instructive to look more closely at the history of these neighborhoods to see if they offer lessons going forward.
Map 4: Tracts Where Median Household Income and Economic Mobility for middle-class Blacks, Hispanics, and Whites all Increased
Neighborhood change is a complex process. There are many factors beyond Planning’s control driving it and the simple measures of household income used in this blog is only one of many possible indicators of how neighborhoods evolve.
However, this quick investigation does suggest that while white residents have been helped by neighborhood improvements, Hispanic residents have benefitted less so, and Black residents have rarely benefitted.
Unfortunately, this problem has existed for too long. But Planning and our partners in the county and region continue to emphasize the urgency of finding solutions. While planning in Montgomery County and elsewhere has traditionally focused on improving quality of life in neighborhoods without considering race, ethnicity, and other existing inequities, it is now clear that public agencies like ours must explicitly address these issues or they will become more entrenched and more severe.
These efforts are currently underway. Lessons from Opportunity Insights’ mobility data have already helped shape the strong regional equity emphasis in ConnectedDMV’s Regional Economic Development Strategy, in which Planning staff are participating. One of Thrive 2050’s three cornerstone themes (along with improving the economy and improving the natural environment) is promoting equity in planning and outcomes. Planning’s broader Equity Agenda for Planning ensures that we continue to find ways to create communities that prosper no matter who lives in them or where they are on the map.
1 Montgomery County has 215 census tracts, but the two tracts that encompass Leisure World have been excluded for this analysis because very few children lived there.
2 I chose this tract because I live there.
3 Adult household incomes from Opportunity Insights data are usually lower than overall median household incomes for a given area because they only compare adult incomes to their peers in their 30s. This age is long before they’ve reached their maximum earning potential.
4 Statistically-minded readers may be wondering whether the relationship between neighborhood household income change and individual economic mobility in Montgomery County is statistically robust. The answer is, “it depends.” For Black children, there is no statistical relationship. In other words, the improvement or decline of a neighborhood isn’t related to the economic mobility of Black children living in it. For whites, the relationship is weakly correlated (coefficient = .117, p-value = .0877), while for Hispanics the correlation is a bit stronger, with a coefficient of .228 and a p-value of .002. While these correlations are evidence of a statistical relationship between neighborhood change and economic mobility for some races and ethnicities, they do not indicate that one causes the other. Additionally, they apply in the negative direction also: declining neighborhoods are associated with downward mobility for Whites and Hispanics.

About the author
Ben Kraft is a research planner in the Research and Strategic Projects Division. His research and planning work focuses on topics related to the economy and employment. Ben has a Ph.D. in City and Regional Planning from Georgia Tech and a Master’s degree in Urban Planning from the University of Michigan.