Montgomery County is a great place to live, work, learn, visit, and grow—but residents have different experiences depending on where they live and their socioeconomic background. One of the most important parts of our work planning for the future of every county community is understanding how socioeconomic conditions differ from neighborhood to neighborhood.
What is the Community Equity Index?
The Community Equity Index (CEI) – a new Montgomery Planning tool – is a composite measure of five indicators (defined below) of how the county’s socioeconomic diversity is distributed, or which neighborhoods have concentrated advantage or disadvantage and which neighborhoods are representative of the county’s diversity. The CEI allows Montgomery Planning, our partner agencies, and the public to better understand socioeconomic characteristics across the county and work towards inclusive solutions to foster a just and fair Montgomery County.
CEI Indicators
Economic insecurity: Percentage of people who are under 200% of the poverty level*
Earnings potential: Percentage of people without a bachelor’s degree (or higher)
Housing stability and wealth building: Percentage of people who rent housing
Barriers to inclusivity and resource access: Percentage of people who speak English less than very well
Income: Per capita income
All indicators are from the 5-year U.S. Census Bureau American Community Survey (2017-2021)
*In 2021, 200% of the federal poverty level for a family of four was a yearly household income of $53,000.
How is the CEI calculated and what does it mean?
The CEI measures how far and in which direction each neighborhood differs from the county average level of socioeconomic diversity, so the CEI score for a neighborhood is the average percentage point divergence from the countywide score of the five indicators. To compute the score, the individual indicator scores are calculated for each neighborhood using census tracts, and the five indicator scores are averaged to yield the total CEI score. Each neighborhood’s score is then categorized based on its percentage point divergence from the county benchmark, which is the countywide average for each indicator. A score within ten percentage points in either direction is considered proportionate,1 while each successive ten-percentage-point divergence puts a neighborhood in the slightly, moderately, or highly disproportionate categories, respectively. A detailed discussion of the CEI’s methodology and rationale is in the technical report.
No standard set of boundaries represents neighborhoods as we experience them every day. The CEI uses census tracts, which are often the smallest geography for which reliable socioeconomic data are available. We use “neighborhood” and “tract” interchangeably when discussing the CEI, but we acknowledge that many tracts—especially large tracts in the northern part of the county—are much larger than neighborhoods.
Tracts that diverge too far from the countywide socioeconomic mix—regardless of the direction of divergence—are places where inequity is present because certain groups are overly concentrated or isolated and contribute to geographic inequity in Montgomery County. The chart below shows how to interpret the CEI categories.
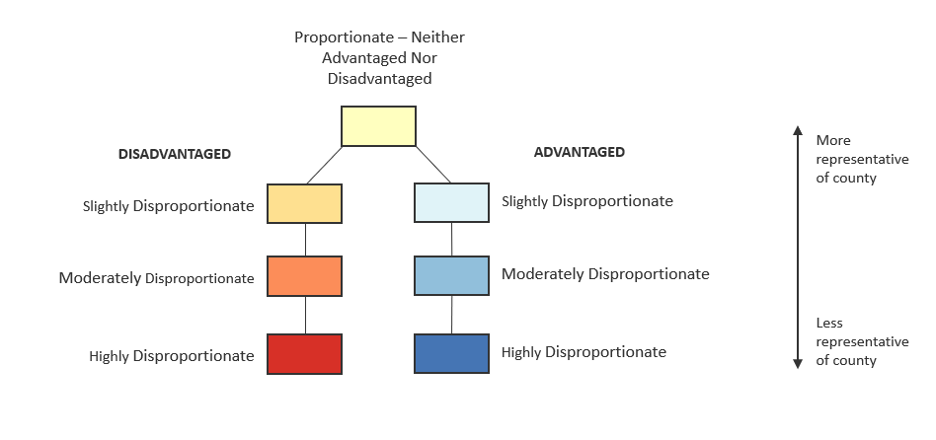
Source: M-NCPPC, Montgomery Planning, Research and Strategic Projects
The yellow box at the top of the chart represents tracts that are the most representative of the county’s full socioeconomic diversity, while the blue, orange, and red boxes reflect varying levels of divergence from that diversity. Disproportionate tracts are places where there is inequity, with the main difference between the orange/red neighborhoods and blue neighborhoods being whether the people living there are disproportionately advantaged or disadvantaged in a socioeconomic sense.
Check out the interactive CEI Explorer.
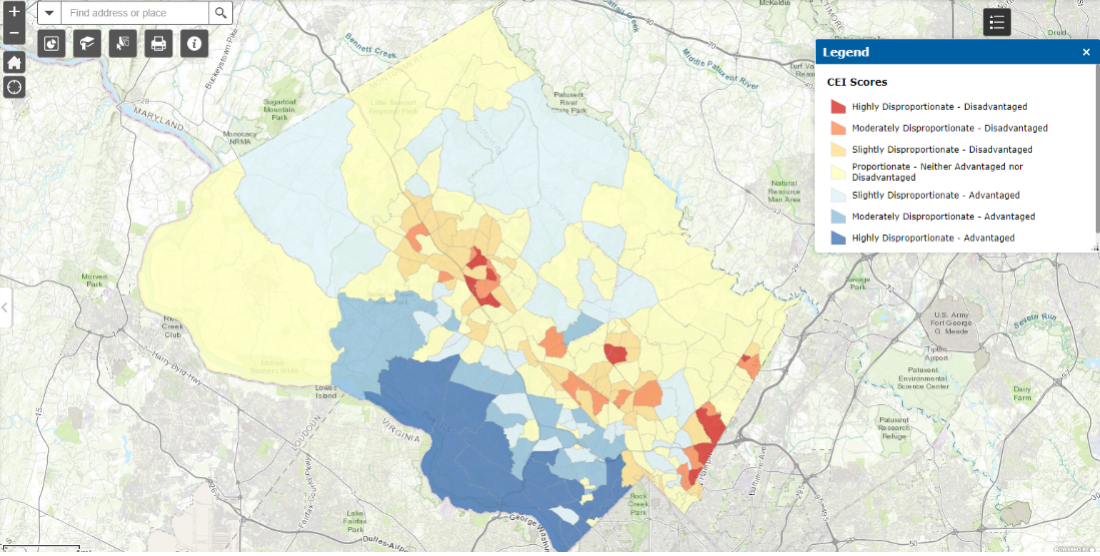
Web-based Community Equity Index (CEI) Explorer. Source: M-NCPPC, Montgomery Planning, Research and Strategic Projects
What does the CEI tell us about the state of socioeconomic equity in Montgomery County?
Montgomery County has 86 tracts that are proportionate, indicated by yellow on the map. This finding does not mean that these neighborhoods and their residents have no planning or policy needs. In fact, one third of the county’s population living below 200% of the poverty level lives in yellow tracts, so there is certainly plenty of need for resources in these places. However, what sets these areas apart is that, for the most part, the people living in or near poverty are not overly concentrated or entirely geographically isolated from people of higher socioeconomic status.
Secondly, the CEI identifies 66 tracts with highly or moderately disproportionate levels of socioeconomic advantage or disadvantage. Of these 66 tracts, 38 are disproportionately advantaged, symbolized by shades of blue, while 28 are disproportionately disadvantaged, symbolized by dark orange and red. Particularly in the southwestern parts of the county, the highly advantaged blue neighborhoods have high concentrations of people with very high incomes, high education levels, and few language barriers. Most of these residents own their homes and very few live in or near poverty. The 28 orange and red neighborhoods along I-270 and in the far eastern sections have high concentrations of residents with the opposite characteristics and are sites of concentrated disadvantage.
The CEI also found the distribution of socioeconomic diversity in the county is associated with racial/ethnic and housing inequity (see charts below). Read more about the CEI’s race/ethnicity and housing analyses in its technical report or watch Montgomery Planning’s CEI presentation before the Montgomery County Planning Board in July 2023.
How can we use the CEI to make Montgomery County a more equitable place?
The CEI is not attached to any policies, programs, or laws, and it cannot change conditions on its own. But it does offer ways to think about how we might increase equity in our county.
For one, yellow neighborhoods are places that have provided space for the county’s full socio-economic diversity, allowing people from a wide range of socioeconomic statuses to live in proximity to each other. While this proximity does not guarantee access to resources or advantageous social networks for disadvantaged residents, it at least provides a precondition for cross-class bonds to form and for disadvantaged people to benefit from spillovers from increased private investment like grocery stores, health care facilities, and quality retail outlets. It also allows more advantaged residents to benefit from cultural richness to which they might not be exposed in a more exclusive neighborhood. Notably, portions of our main transit-accessible downtown areas such as Bethesda and Silver Spring are proportionate, or yellow tracts, indicating high socioeconomic diversity.
Orange and red areas need more investment to help make residents more economically secure, reduce their language barriers, have access to homeownership opportunities, and pursue higher education. New investment in these areas along with careful anti-displacement measures can also attract new residents to improve socioeconomic diversity. Most residents in blue neighborhoods are already economically secure, so these places need investments in housing – especially affordable housing – so that new residents can have access to the amenities there.
Montgomery Planning will apply the CEI to inform our master plans, studies, and policies, and we encourage residents and our partner agencies to use it to develop novel applications. While the CEI offers a new approach to analyzing equity, it is only a starting point. Equity is a complex topic that cannot be reduced to a single index. This tool should be used holistically with other tools, such as community outreach, land use analysis, and research into local history to fully assess context and develop ways to advance equity in neighborhoods across the county.
1 This scoring system is based on a method proposed by Richard Rothstein for gauging the level of racial residential segregation of a neighborhood in his book The Color of Law.

About the author
Benjamin Kraft is a research planner in Montgomery Planning’s Research and Strategic Projects Division. His research and planning work focus on topics related to the economy and employment. Ben has a Ph.D. in city and regional planning from Georgia Tech and a master’s degree in urban planning from the University of Michigan.
walter weiss
you should add the names of towns and roads to your CEI map. it is very hard for me to figure out what each tract represents
Montgomery Planning
If you click on the map embedded in the blog, it will take you to the CEI Explorer where you can zoom in so that road and place names are visible under the index colors.