
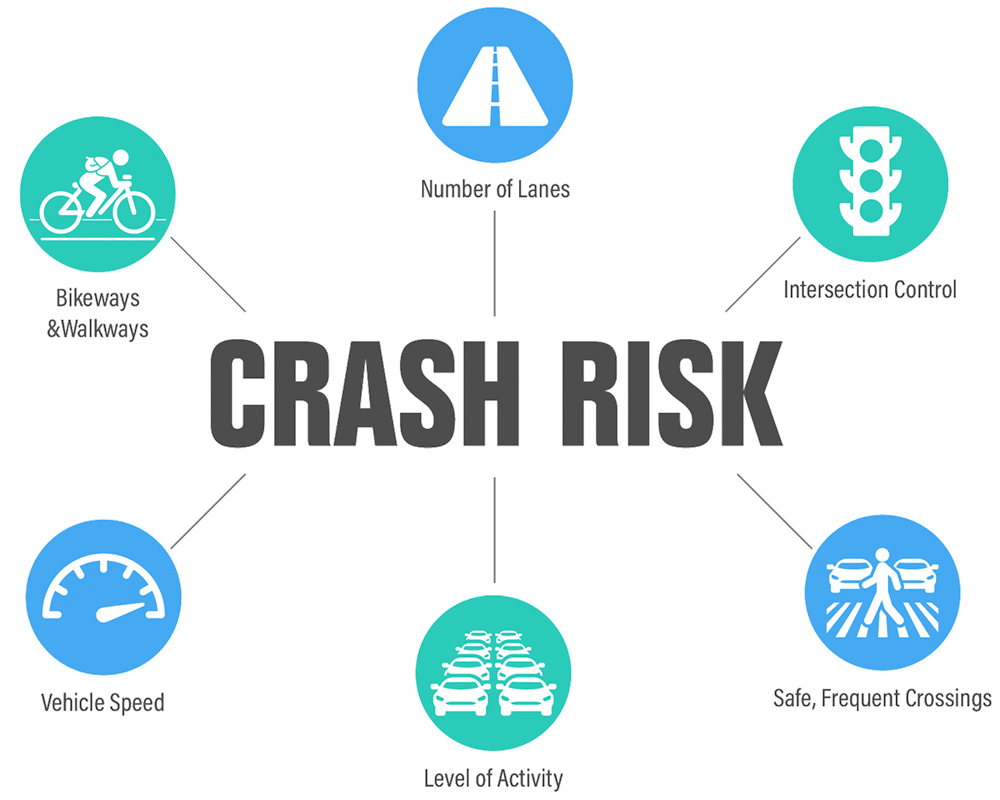
In 2016, Montgomery County adopted a Vision Zero policy, with a goal of eliminating severe injuries and fatalities on our roadways by 2030. The county has made significant progress and investments towards this goal over the past seven years, through additional data analysis, planning, and funding of capital projects to improve safety. However, there is still a lot of work to be done. In each year since the policy was adopted, there have been over 200 severe injuries and fatalities in Montgomery County. We have a long way to go towards reaching zero.
Traditional transportation planning looks at the locations that these previous crashes have occurred and focuses investments on improving those locations. Montgomery Planning wants to look beyond this reactive strategy to safety, and instead take a more proactive approach. We have developed a new strategy and methodology to improve road safety for drivers, bicyclists and pedestrians called the Predictive Safety Analysis. This proactive data-driven approach works to prevent severe and fatal crashes before they happen.
The Predictive Safety Analysis used statistical modeling to develop Safety Performance Functions, which are equations that estimate the expected number of crashes at a given roadway segment or intersection based on exposure, roadway characteristics, land use, and other variables. This approach is preferred over simply looking at locations with a history of crashes, as multiple locations may have the same characteristics (number of lanes, speed limit, crosswalks, etc.) but different crash history purely as the result of luck and the random nature of crashes.
Selecting Crash Types
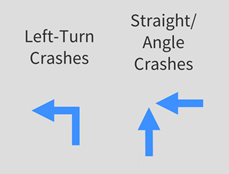 The Predictive Safety Analysis included an analysis of specific crash types. Six crash types were selected to cover a large number of crashes, severe injuries, and fatalities but also be specific enough to point to specific safety treatments:
- Pedestrian crashes after dark at intersections
- Pedestrian crashes along segments with vehicles going straight
- Bicycle crashes at intersections
- Left-turn crashes at intersections (all modes)
- Motor vehicle straight/angle crashes at intersections
- Single vehicle crashes along segment
Overall, the six crash types comprise a significant portion of the county’s severe injuries and fatalities between 2015 and 2019 – 73% for pedestrians, 65% for bicyclists, and 41% for vehicle drivers and passengers.
Analysis Findings
Crash estimates were developed countywide for the six crash types, and they identified key trends based on land use and community demographics:
- As a suburban county, much of Montgomery County’s crash risk is in the suburbs. The county’s suburban areas and the high-speed, high-volume suburban Boulevards (like Georgia Avenue and Veirs Mill Road) that run through them have the highest number of Top 200 Locations (locations in the county with the highest crash risk) in the county for most crash types. To reach Vision Zero, safety improvements must address these locations.
- Yet Downtowns and Town Centers have the highest average crash risk. On a per-intersection or per-roadway segment basis, crash risk is highest in the county’s urban areas, particularly for pedestrian and bicycle crash types. Systemic improvements on Downtown Boulevards and Town Center Boulevards – and more broadly in Downtown and Town Center areas – like Silver Spring and Aspen Hill, respectively – would yield the greatest benefits per location improved.
- Safety improvements in Equity Emphasis Areas (EEAs) should be prioritized. Across all metrics, crash risk is disproportionately concentrated in EEAs. More than half of the top 200 locations for pedestrian crash types are located within EEAs (even though only 16% of county intersections are in EEAs), and the average crash risk in EEAs far exceeds that for non-EEAs for five of the six crash types. Focusing investments in EEAs can mitigate this disparity and balance crash risk in the county.
Looking Towards Safety Improvements
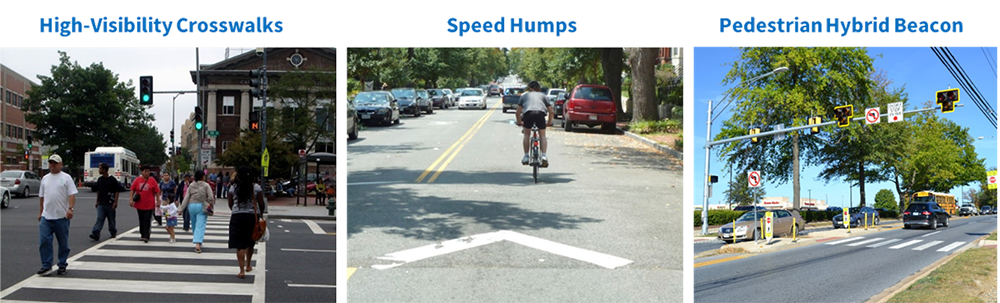
Based on these findings, the Predictive Safety Analysis provides a countermeasure evaluation tool for planners, engineers, and decisionmakers to assess different investment scenarios based on their goals and priorities. The tool can be used to determine which countermeasures – like high-visibility crosswalks, all-way stop control, and speed humps – to implement and how may locations to improve, and it evaluates the effectiveness of different countermeasures in several ways: potential crash reduction, cost per crash reduced, and percent of locations in Equity Emphasis Areas.
The evaluation tool reveals the benefit of low-cost, systemic improvements. While there is a need for some large capital projects, like an intersection redesign or projects that widen the right-of-way to better accommodate bicyclists and pedestrians, each project is costly and takes years to implement. By contrast, many systemic treatments can be implemented quickly with limited study and – when implemented at scale – are as effective, if not more, at reducing crashes.
Table 1 below demonstrates this phenomenon through an example of how $200,000 could be spent to reduce pedestrian crashes along segments. As countermeasures vary in their costs, how many locations can be addressed with $200,000 differs across the countermeasures. Updating or adding visibility crosswalks and constructing speed humps are far less costly than a Pedestrian Hybrid Beacon (PHB), so many more locations could be updated with this treatment (65 and 40 locations, respectively, vs. 1 location). Given the effectiveness of these treatments and the number of locations addressed, the potential crash reduction for constructing speed humps far exceeds the other treatments, yet the per-location crash reduction is lower than that of constructing a PHB.
| Scenarios | High-Visibility Crosswalks | Speed Humps | Pedestrian Hybrid Beacon | |
|---|---|---|---|---|
| Number of Locations | 65 | 40 | 1 | |
| Total Estimated Cost | $199,600 | $200,000 | $175,000 | |
| Long-Term Impact (10 Years) |
Potential Crash Reduction | 21.7 | 128.9 | 3.93 |
| Cost per Crashes Reduced | $9,210 | $1,550 | $44,580 | |
| % of Locations in Equity Emphasis Areas | 54% | 53% | 100% | |
Where We Go From Here
The Predictive Safety Analysis is the first step towards implementing a proactive approach to safety. It is now incumbent upon planners, engineers, and decisionmakers to apply the findings of this analysis. There are several uses of the results of the Predictive Safety Analysis:
- Apply Data-Driven Planning: The Predictive Safety Analysis provides the data, analysis, and tools to shift the county’s approach and implement improvements where they are needed and more equitably. This data can combat the “squeaky wheel” by distributing resources equitably and to where they are most needed. In addition, the data can support funding requests, both as part of the local or state budgeting process as well as through grant applications.
- Identify Locations with High Crash Risk: The results can be used to identify location types that are likely to experience a high number of crashes. This data can be used to inform Capital Improvement Program (CIP) project prioritization, prioritization of off-site mitigation for new development, a focus for transportation improvements within master planning areas, and Mandatory Referral.
- Prioritize Safety Improvements: The tools allow implementing agencies to prioritize where to implement systemic safety treatments as well as to assess which safety treatments may be the most effective at reducing crashes. This information can make the case for additional funding for CIP level-of-effort programs, inform master plan recommendations, and support updates to the Growth and Infrastructure Policy.
- Determine Locations with Similar Conditions: The databases developed include hundreds of variables related to the transportation, land use, and demographic context in which the crash occurred. In the wake of future severe or fatal crashes, these data can help identify other locations similar to the crash location and inform a more systemic response to the incident.
The Planning Department, Montgomery County Department of Transportation, and the County Council can use this information in a variety of ways to inform future recommendations, priority projects, and funding allocations. Taking a more proactive, data-driven approach to transportation safety impacts all facets of the transportation planning process.
Check out the July 21, 2022 Planning Board presentation.
Questions or comments about this? Email me at Jesse.McGowan@montgomeryplanning.org.

About the author
Jesse Cohn McGowan is a transportation planner in the Countywide Planning & Policy Division at the Montgomery County Planning Department, part of The Maryland-Capital Park and Planning Commission (M-NCPPC). Jesse manages Vision Zero and transit planning at the Planning Department. She has a Bachelor of Arts in Urban Studies from Brown University and Masters of City and Regional Planning from the University of North Carolina in Chapel Hill.