Note: This archive page is no longer updated and may contain out-of-date information.
 As I explained in the previous post, a compact form of development is a pillar of urbanism and Thrive Montgomery’s approach to land use. Now I want to show how Thrive Montgomery applies this idea and how this aspect of urbanist thinking represents continuity with – not a departure from – the Wedges and Corridors plan and the map that gave that plan its name.
Polycentric urbanism and the original Wedges and Corridors map
The Wedges and Corridors map specifies where growth should be focused and what kinds of development should be allowed in different places. It has gone through a series of “refinements” – I’ll discuss some of these changes and why they matter – but here’s the original version adopted in 1964:
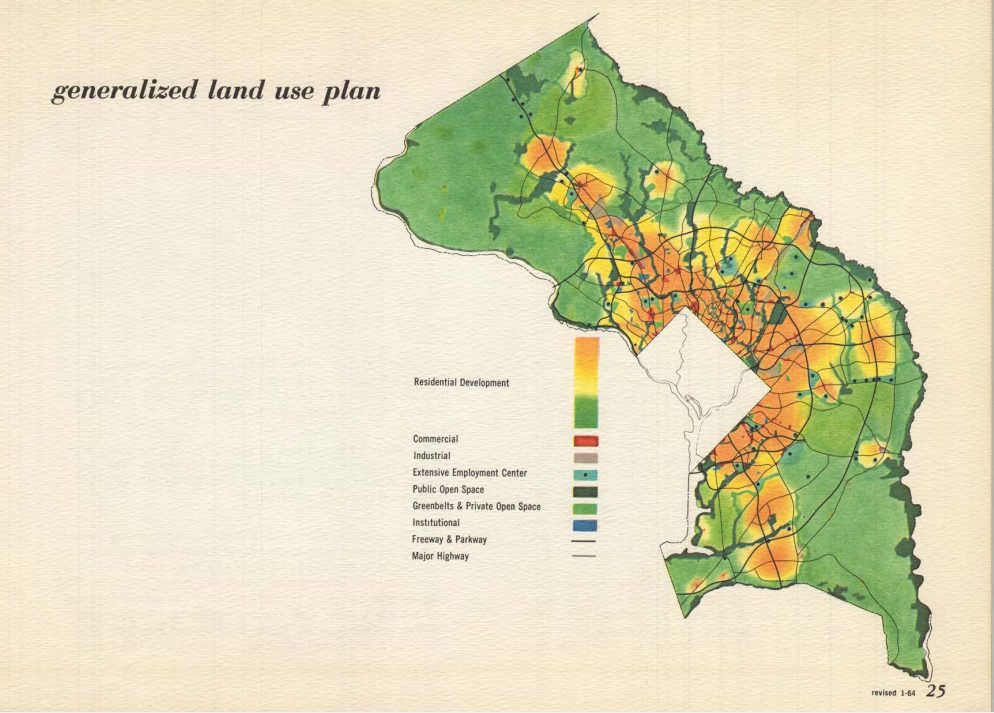
The Generalized Land Use Plan from the 1964 “On Wedges and Corridors Plan” 1964 showing Urban and Rural Patterns in Montgomery and Prince George’s Counties.
The 1964 plan was visionary in recognizing that land is a valuable resource, and in order to prevent a “scattered pattern” of development it recommended two alternative patterns: the urban pattern and the rural pattern. The urban pattern was supposed to be compact and concentrated in the existing “urban ring” closest to the District of Columbia and proposed corridor cities along significant transportation corridors. The rural pattern was intended to “mold” the urban pattern by constraining its footprint; to provide open space for recreation; to support farming, hunting, fishing and other “natural resource activities;” and to protect resources such as clean water.
The map was designed to provide more specific direction for land use planning, defining the “urban ring” to encompass the area closest to the District of Columbia and identifying which major roadways would be appropriate for high-density “corridor cities” to accommodate future growth. The 1964 plan covered Prince George’s as well as Montgomery County, so the corridors identified included Route 50 and Route 5/Route 301 along with Route 355/I-270 (known then as “E-70”) and Route 29/I-95. The large “agricultural wedge” shown in green on this map was supposed to be set aside for farming, and the “residential and suburban wedges” shown here in yellow were considered appropriate for housing in subdivisions of low to moderate density.
Before we go any further, you should recognize that the premise of the Wedges and Corridors plan and this map is exactly the same idea behind the land use transect that is the cornerstone of urbanist thinking (and also overlaps with concepts such as “smart growth” and transit-oriented development) popularized by Andres Duany of DPZ. I mentioned this concept in the last post, but I’m showing it again because it expresses the idea that development must be organized along a continuum of scale and intensity to maximize the success of the uses appropriate at each point along the continuum:
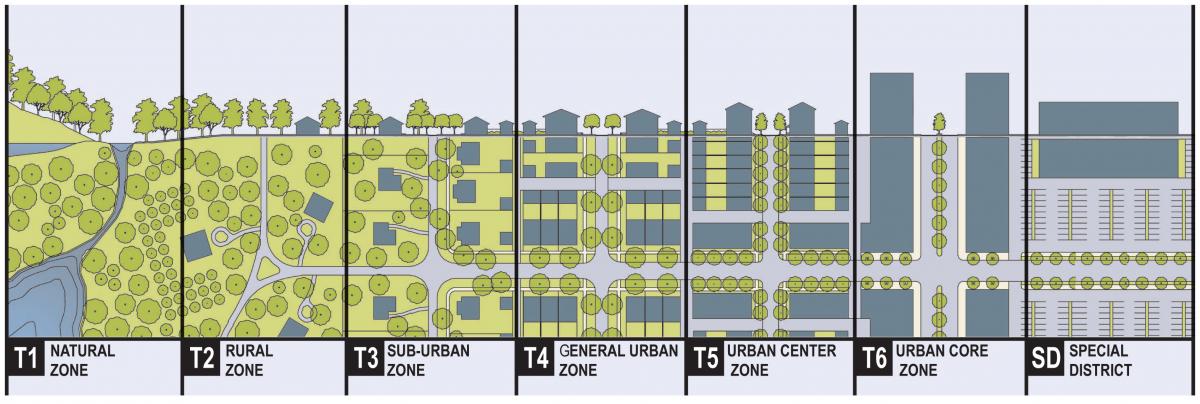
The idea of the “transect” is central to the recommendations in Thrive Montgomery 2050. Image courtesy DPZ CoDesign.
To put it another way, the Wedges and Corridors plan reflects the urbanist insight that the rural pattern depends on the urban pattern and vice versa. For this reason, the organizing principle of the Wedges and Corridors plan might best be described as “polycentric” urbanism, because it recommends focusing growth in a series of cities radiating out a limited number of corridors rather than development around a single “bullseye.” Nonetheless, it unmistakably reflects a commitment to intensive development in a limited footprint as the building block of successful land use and transportation planning.
Route 29, Georgia Avenue, and the 1993 map
Unfortunately, subsequent master plans and land use decisions did not always adhere to the Wedges and Corridors concept, making growth less efficient and sustainable. The county’s planners, elected officials, and civic leaders took some steps to limit sprawl, most notably by creating the Agricultural Reserve in 1980, setting aside more than 90,000 acres of land primarily for farming and related uses. Some of these initiatives, however, took the Wedges and Corridors plan in a different direction and attempted to stifle development in some of the limited areas originally designated as appropriate for growth. Consider this map, adopted in 1993 as part of a “refinement” to that plan and in effect today:
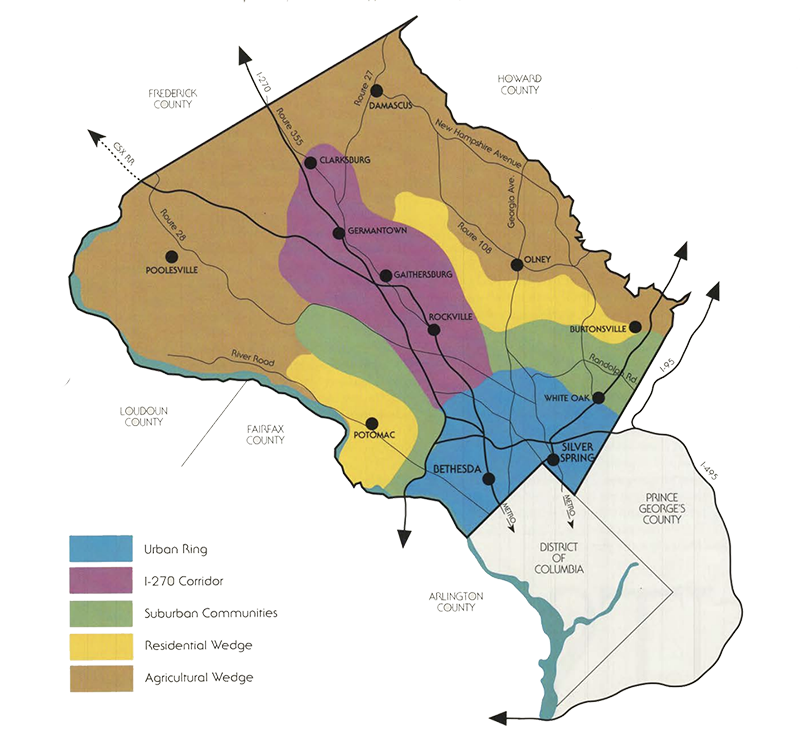
The On Wedges and Corridors Geographic Components from the 1993 General Plan Refinement.
As you can see, this map shows a shrunken agricultural wedge – reflecting the loss of farmland over the previous three decades – in brown. Most remaining farmland was included in the Agricultural Reserve. The 1993 map shows the residential wedge and “suburban communities” in yellow and light green, generally following the 1964 map. But while the urban ring – generally south of Randolph Road – appears in blue along with the I-270 corridor in pink, the I-95/Route 29 corridor is conspicuously absent.
The politics of growth in Montgomery County seesawed back and forth for most of the 20th century, but in the late eighties and early nineties anti-growth politicians and their supporters were ascendant in the East County. The 1981 master plans for White Oak and Fairland had encouraged “transit-supportive densities” along the Route 29 corridor, and the grade-separated interchanges along this route were designed with space for the addition of commuter rail tracks in both directions. By 1993, though, concerns about traffic congestion, environmental degradation, and the belief that existing residents had little to gain from allowing additional development led to the erasure of the corridor from the growth map.
This decision had far-reaching consequences for the East County, and I will have more to say about its effects on racial and socioeconomic equity in a future post. For now, though, I just want to highlight the fact that the 1993 map represented a departure from the 1964 plan’s recommended growth footprint. Moreover, the 1964 plan had not anticipated the construction of Metrorail’s Red Line along Georgia Avenue or its effects on that part of the East County. The absence of the Georgia Avenue and Route 29 corridors widened the gap between what the map shows and the reality of what has happened.
A new map with new – and old – ideas about where and how to grow
Thrive Montgomery proposes a new map that more realistically portrays existing patterns of development and guides future growth in ways that support a high quality of life and improve environmental sustainability by encouraging infill and redevelopment to curb sprawl. Here’s the map:
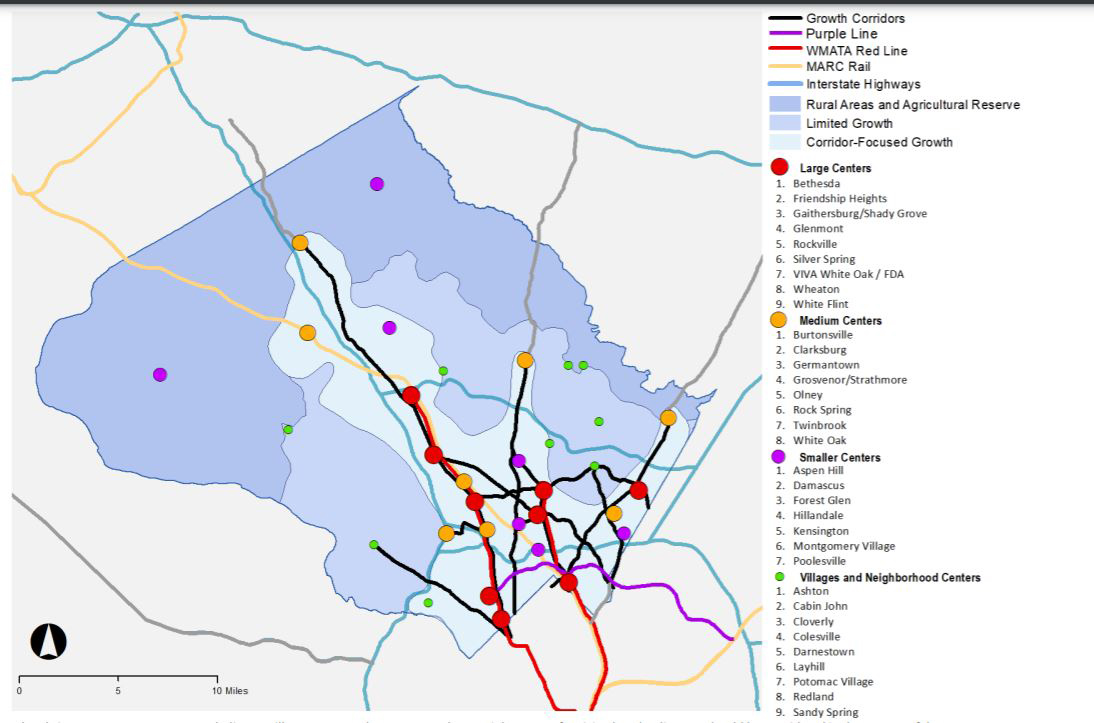
The Thrive Montgomery 2050 Growth diagram illustrates growth concepts and potential centers of activity, but the diagram should be considered in the context of the Compact Growth and Complete Communities chapters. The centers of activity shown are not exhaustive of all existing or potential centers.
Thrive Montgomery directs development to major transportation corridors such as Route 29/I-95 and Georgia Avenue as well as the “urban ring” and the Rockville Pike/I-270 corridor, where growth was channeled by earlier plans. It also recognizes some east-west transportation corridors as appropriate for focused growth, such as the Purple Line and Randolph Road. It prioritizes public investment in infrastructure, such as transit, along these corridors and leveraging it to attract private investment.
You will notice that the map also shows a handful of communities outside of the designated growth footprint in places that are not on major transportation routes, such as Poolesville, Damascus, and Sandy Spring. Thrive Montgomery recognizes that these communities not only exist but that they serve the surrounding areas in many positive ways. The plan recommends limiting growth beyond corridors to compact, infill development and redevelopment in “complete communities” at appropriate scale.
Why should we be encouraging development in communities outside the growth footprint and adding corridors to the footprint established by earlier plans? Won’t this just produce more sprawl? Those are good questions, and I think I have good answers – but they will come in a future post. For now I hope I have shown how the urbanist ideas about a compact form and a transect-based approach to development in Thrive Montgomery are rooted in concepts we have been applying since 1964.
About the author
Casey Anderson has served on the Montgomery County Planning Board since 2011 and was appointed Chair in 2014. He also serves as vice chair of the Maryland-National Capital Park and Planning Commission, the bi-county agency established by state law that regulates real estate development, plans transportation infrastructure, and manages the park systems in Montgomery and Prince George’s Counties.
Michael La Place
“Wedges and Corridors” lives! Good Planning is never out of date.
Jeff Gates
The maps presented here (and in the county’s original document) are not easily readable. Nothing is labeled in the last map and little in the first map. This isn’t very helpful in understanding the impact of these changes in everyone’s neighborhood.