Note: This archive page is no longer updated and may contain out-of-date information.
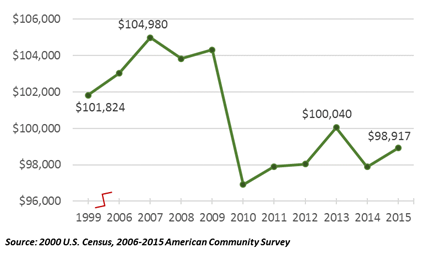
For the past eight years, the median household income in Montgomery County has remained below the level during the Great Recession. Moreover, median household incomes have yet to recover to the 1999 benchmark of $101,824 after the precipitous drop in 2010 to $96,913 (illustrated in Figure 1). The median household income – the income at which half of the households are above and half are below – adjusted for inflation, dropped 5.8 percent (-$6,063) from its peak in 2007 to $98,917 in 2015.[1] The latest estimate is 2.9 percent lower than the adjusted 1999 median household income of $101,824.
Figure 1. Montgomery County Median Household Income 1999-2015 (constant 2015 dollars)
Still considered one of the wealthiest counties in the nation, Montgomery’s median income lost ground relative to other counties, as its national ranking slipped from 11th in 2014 to 15th in 2015.
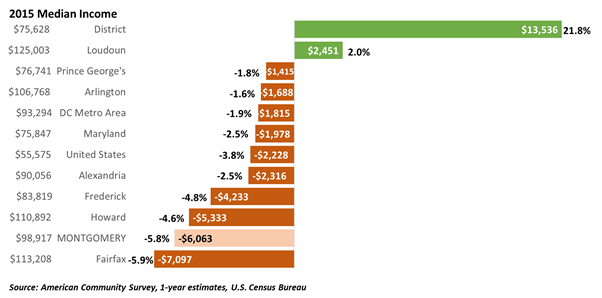
Montgomery County is not alone in its decline in real income—this drop is a significant national and regional issue, evident in most other local jurisdictions (as shown in Figure 2). The median household income in the Washington, D.C. metropolitan area dropped $1,815 since 2007 to $93,294 in 2015. Montgomery’s inflation adjusted loss in income since 2007 (-5.8 percent) is greater than the region (-1.9 percent) and the nation (-3.8 percent). Fairfax County experienced a similar level of income loss with a 2015 median household income that is 5.9 percent below its peak in 2007.
Locally, only the District of Columbia and Loudoun County have 2015 median household incomes exceeding pre-recession levels. The District, with the lowest median income in the region, is the only local jurisdiction with steadily rising incomes since 2007, up 21.8 percent and a gain of $13,536 to $75,628 in 2015. The District’s successful efforts to attract new residents, reversing decades of declining population, subsequently increased demand for higher-priced housing, drawing higher incomes able to afford living in the city.
Comparatively buffered from steep income decline post-recession, Loudoun County, one of the fastest growing and highest income counties in the nation, recently recovered from a weak, high-end housing
market. This recovery contributed to the 2 percent rise in median income above its 2007 level. The increase amounted to $2,451, contributing to a median income of $125,003 in 2015.
Figure 2. 2015 Median Household Income and the Change in Household Income 2007-2015 (constant 2015 dollars)
Foretelling the recovery of median household income in Montgomery County to pre-recession levels is not easily discerned, given underlying, conflicting economic factors. However, the county’s employed resident labor force exhibits potentially positive signs, such as a declining unemployment rate at 3.1 percent last November from a high of 6 percent in 2010 or last year’s second highest regional gain in employed residents of 7,500.[2]
In contrast, at-place employment, or jobs located in Montgomery County that can be filled by anyone in the region, another facet of potential income growth, has not returned to pre-recession employment levels despite six consecutive years of job gains. Examination of recent changes in industry composition of at-place employment and associated average annual wages are not indicative of potential income growth (Figure 3). More than half of the County’s new job growth last year occurred in lower-paying sectors, such as education and health services ($49,088 average annual wage) and leisure and hospitality ($24,232).
Figure 3. Montgomery County Employment Change by Sector, March 2015-2016
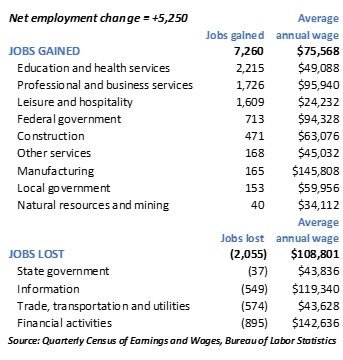
Higher-paying sectors, such as professional and business services ($95,940), federal government ($94,328), and advanced manufacturing ($145,808), contributed only one third of the recent job gains. At the same time, job losses in the county (loss of about 2,100 jobs compared to 7,300 added between March 2015 and 2016) were concentrated in higher-paying sectors, including financial activities ($142,636) and information ($119,340).
Many competing economic factors make it uncertain how long household income will remain stagnant in Montgomery County and the influences of population migration and the aging population also affect the trends. On the positive side, Montgomery County attracts well-educated new residents with earning potential.
New residents are highly educated (33 percent with advanced degrees) and they are joining an established concentration of well-educated adults. In 2015, 3 out of 5 adults, age 25 and older in the county, had at least a bachelor’s degree and 31 percent held advance degrees. A segment of new residents brings wealth into the county as a higher percentage of people with household incomes of $100,000 or more moved into the county than left (44 and 38 percent, respectively). A slightly higher percentage of people leave the County with household incomes below $34,000, 18 percent, compared to the 15 percent of people who move in.[3]
The County’s aging population may assert downward pressure on household incomes. Over the next 10 years, the majority of baby boomers, ages 51 to 69 in 2015, will transition from being prime wage earners to leaving the work force and likely lower retirement income. In 2015, the average retirement income at $42,746 was one-third of the County’s average income of $134,527.[4]
From 2015 to 2025, the number of people in the 44 to 64 age group, prime wage earners, is forecasted to drop 5 percent from 28 percent. Montgomery County may expect a 28 percent increase in senior population driven by the large group of aging baby boomers who will be 61 to 79 years old in 2025.[5] With the movement of the baby boomers out of the workforce, the worker to senior dependency ratio changes from 4.5 in 2015 to 3.5 in 2025. This shift will further inhibit growth of annual median household incomes in Montgomery County.
As a member of the Research & Special Projects Division, Pamela Zorich tracks local and regional demographic trends quantifying growth and change and extracts meaningful stories from data to fill the needs of planners, policy analysts, and community service providers.
[1] The household income figures cited are from the U.S. Census Bureau’s American Community Survey 1-year estimate series unless otherwise noted. Historical income is adjusted for inflation and reported in 2015 constant dollars.
[2] “Employment Monitor: Sept 2016”, Trendsheet Quarter 1 2017, Research and Special Projects, Montgomery County Planning Department.
[3] “County-to-County Migration Flows”, 2010-2014 American Community Survey 5-Year Estimates, U.S. Census Bureau.
[4] “Selected Economic Characteristics, DP03”, 2015 American Community Survey 1-Year Estimates, U.S. Census Bureau.
[5] Projections by age prepared by Maryland Department of Planning, revised January 2015.