Patterns of Inclusive Growth, Concentration of Poverty, and Displacement (2000–2019)
Using public U.S. Decennial Census and American Community Survey data, Montgomery Planning has investigated neighborhood change across Montgomery County and the Washington, DC, metropolitan region in support of more equitable and data-driven decision making. In examining how shares of low-income versus middle-high income households in neighborhoods changed from 2000 to 2019, Montgomery Planning found that—contrary to popular perception—concentration of low-income households is a more prevalent issue in Montgomery County than displacement and that low-income concentration disproportionately burdens Black and Latino households. The research also shows that neighborhoods can grow inclusively—that is, without displacing low-income residents—if enough housing is added.


Analysis
Building on methods used by the University of Minnesota’s 2019 report American Neighborhood Change in the 21st Century(opens in a new tab), Montgomery Planning used more recent data for the greater Washington, DC, area to track changes in neighborhood composition over time (not individual resident movements), in conjunction with changes in the amount of housing. In the United States, as in Montgomery County, rising concentration of low-income households the most common form of neighborhood change. Displacement as the prevailing type of neighborhood change is limited to a handful of major coastal cities, including Washington, DC. Yet, even where it occurs, displacement tends in many cases to be limited to the central city, often not reaching its suburbs.
Montgomery County Findings
Growing inequality between neighborhoods is a problem in Montgomery County, and the failure to build enough housing is a major contributing factor to this inequality.
One of the main findings of this study is that far too many lower-income families live in neighborhoods with high and increasing concentrations of poverty. The people in these neighborhoods are predominantly Black and Latino, so this pattern perpetuates segregation. Additionally, the dynamic in Montgomery County (as well as Prince George’s County) is different than the rest of the region—in Arlington and Fairfax Counties, Alexandria City, and Washington, DC, displacement is a bigger problem than poverty concentration.
Whether low-income people in a neighborhood are facing displacement from their current homes or the concentration of poverty around them, both problems are the result of decreasing socio-economic diversity within a neighborhood. In the case of neighborhoods where displacement is happening, neighborhoods are becoming too uniformly wealthy, while neighborhoods where poverty is concentrating are becoming too uniformly poor.
However, contrary to popular perception, neighborhoods can get wealthier and more socio-economically diverse at the same time, but not without adding housing (see chart below). Thus, building more housing is key to preventing displacement and poverty concentration, and fostering socio-economically inclusive communities.
Though displacement occurs and needs to be addressed, our research finds that in Montgomery County it is a secondary concern to the concentration of poverty within neighborhoods, and this finding has major racial equity and social justice implications. For example, focusing affordable housing construction only in neighborhoods where poverty is already concentrated exacerbates the problem. A better approach is to balance affordable housing across the county to facilitate equitable access to resources.
New housing construction, both market rate and affordable, has critically enabled neighborhood diversity in the last two decades. Neighborhoods with more construction have unequivocally seen grown inclusively (that is, adding more residents of all income levels), while those adding the least housing have either seen displacement or poverty concentration. Building more housing has given residents more options when deciding where to live. By contrast, not building limits families’ options and worsens concentrations of low-income households where they already exist.
Learn more by viewing the May 19, 2022 presentation to the Planning Board.
To explore the data employed in this study, check out Montgomery Planning’s programming code and dataset(opens in a new tab) on the online software development repository GitHub.
Below are a few key data points.
Montgomery and Prince George’s Counties have more tracts with low-income concentration while DC and other nearby Virginia jurisdictions have more tract where displacement is occurring.
Montgomery and Prince George’s Counties have more people living in tracts experiencing low-income concentration than displacement, while the rest of the region has more people living in tracts experiencing displacement.
People of color in Montgomery County are more affected by poverty concentration than by displacement.
Percent of racial or ethnic group in area living in tracts of each category
“Displacement” tracts in Montgomery County have seen larger net growth in Latino population than white population and a smaller net decline in Black population than those tracts in the rest of the region. “Inclusive Growth” tracts have seen gains in Black, white, and Latino residents.
In both the Washington DC region and Montgomery County, tracts that experienced inclusive growth added by far the most housing, suggesting that building housing has a prominent role in promoting inclusive growth.
Next steps
Building new housing throughout Montgomery County, including in areas that have not seen new development, will play a critical role in enabling neighborhood diversity—and in promoting inclusive growth everywhere.
Looking ahead, this research can more generally inform neighborhood-level strategies to expand inclusive growth by allowing people to stay in place, creating opportunities for new residents, and increasing racial, ethnic, and economic diversity. In addition to building new housing, other proven strategies include providing associated public amenities like transit, parks, and affordable housing.
It’s also worth noting that, despite widespread and understandable concerns about the potential displacement of existing residents, the data show that limiting new housing development is actually more likely to displace current residents—or to further embed them in a heavily concentrated low-income neighborhood.
Frequently asked questions
Montgomery Planning saw the University of Minnesota study as offering an important perspective on neighborhood change that employed straightforward concepts and methods. By recreating and updating its methodology to focus on the Washington, DC region, the Neighborhood Change study seeks to similarly understand meaningful trends to support more equitable and data-driven decision making in the future.
This research was conducted primarily with the R statistical computing platform, incorporating U.S. Census and American Community Survey data. The code and data set are available on the online software development repository GitHub.
These findings support the policies being developed under Thrive Montgomery 2050 and the Attainable Housing Strategies Initiative. Montgomery Planning will use these findings to also develop recommendations in master plans for individual areas and neighborhoods to promote inclusive growth.
One interesting finding of this study was that there is a regional divide in neighborhood change experiences over the last two decades. Northern Virginia (Arlington and Fairfax Counties and Alexandria City) and Washington, DC, have seen many more neighborhoods experience displacement than the concentration of poverty, while Montgomery and Prince George’s Counties face more severe levels of low-income concentration than displacement.
Methodology
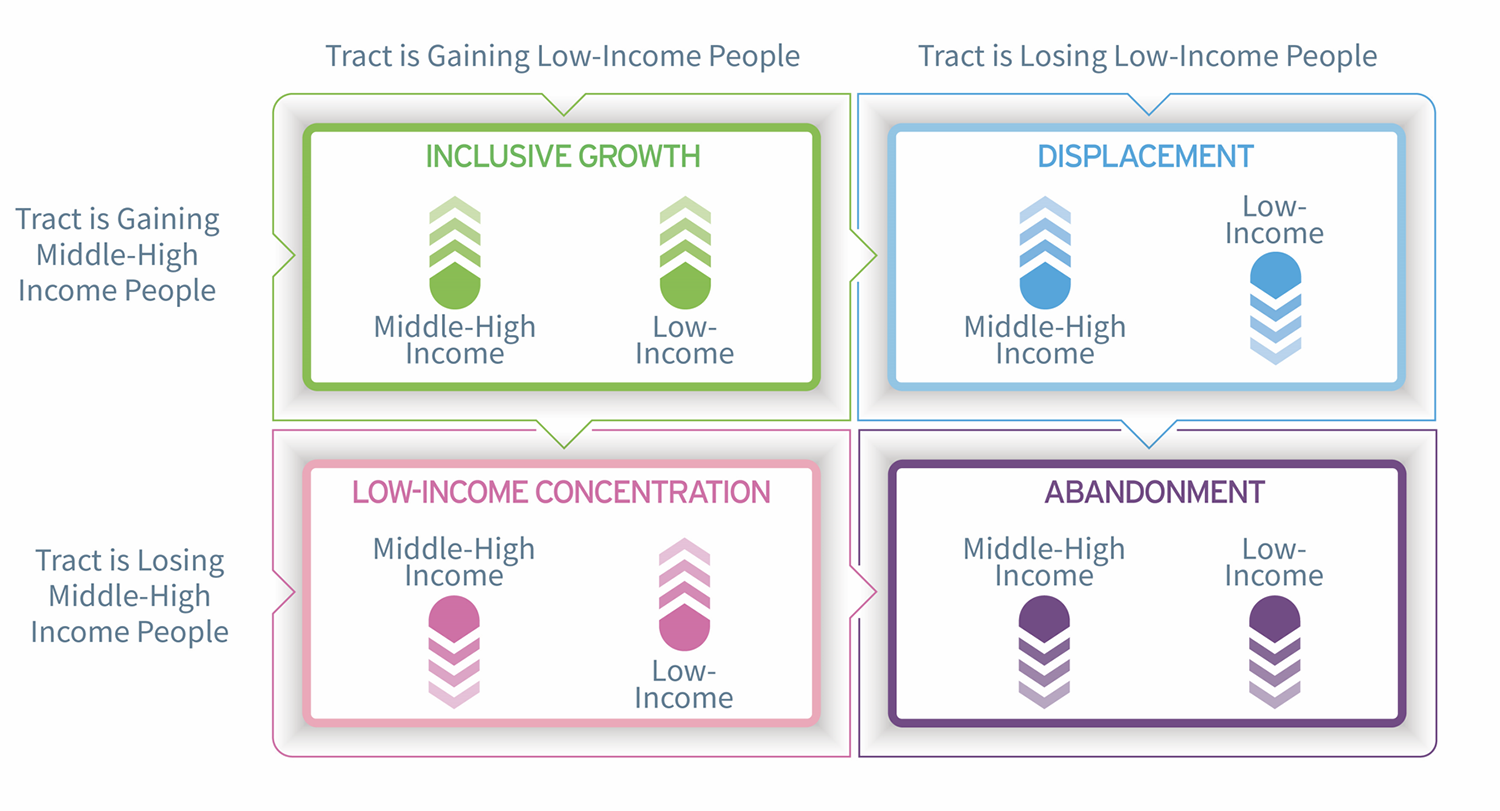
Neighborhood Change Criteria
| Economic trajectory | Percentage Change in Number of Middle-High Income* People | Change in Tract Share of Low-Income** People | Neighborhood Change Category | Absolute Change in Number of Low-Income People | Map color |
|---|---|---|---|---|---|
| Economic decline (decline of middle-high income population) | -10% or more | +5% or more | Abandonment | -1 to -699 (moderate***) | |
| < -700 (strong***) | |||||
| Low-income concentration | 1 to 699 (moderate) | ||||
| > 700 (strong) | |||||
| Economic expansion (growth of middle-high income population) | +10% or more | -5% or more | Displacement | -1 to -699 (moderate) | |
| < -700 (strong) | |||||
| Inclusive Growth | 1 to 699 (moderate) | ||||
| > 700 (strong) |
*Middle-High Income = at or above 200% of the federal poverty level ** Low-Income = below 200% of the federal poverty level In 2019, 200% of the poverty level for a family of four was $51,500; equivalent to about 40% of AMI for family of four in 2021 *** The terms “strong” and “moderate” for these categories were not used in the Univ. of Minnesota’s American Neighborhood Change Study. They should not be confused with Minnesota’s “strong” and “weak” models (see p. 5 of the full UMN report).